
BEA Estimates 4th Quarter 2017 GDP Growth To Be 2.54%
In their first (and preliminary) estimate of the US GDP for the fourth quarter of 2017, the Bureau of Economic Analysis (BEA) reported that the US economy was growing at a +2.54% annual rate, down -0.62% from the prior quarter.
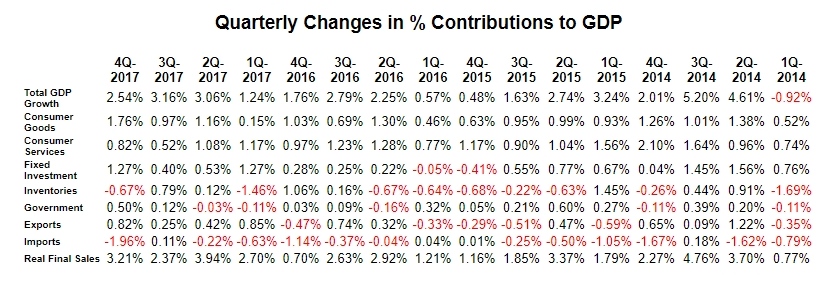
This is a report of sharp contrasts. Although the headline number is down relative to the prior quarter, this report actually contains the strongest consumer spending growth (+2.58%) since the 2nd quarter of 2016. But offsetting that good news is the worst import contribution (-1.96%) since the 3rd quarter of 2010. And inventories flip-flopped from boosting the headline last quarter (+0.79%) to being a major drag on the headline this quarter (-0.67%). Fixed investment (at a +1.27% contribution), exports (adding +0.82% to headline) and government spending (contributing +0.50%) were also impressive. Netting all of this, the BEA's "bottom line" for the quarter (their "Real Final Sales of Domestic Product", which excludes inventories) improved substantially to +3.21%, up +0.84% from the prior quarter.
Casting a shadow on the good news from the consumer spending uptick is other data showing where the spending is actually coming from. Real annualized household disposable income shrank -$12 from the previous report to $39,213 (in 2009 dollars) -- and the 3rd quarter number was revised sharply downward by -$47. The household savings rate plunged to 2.6%, which is lower than even the 2.7% recorded third quarter of 2007 -- at the very precipice of the "Great Recession."
For this revision, the BEA assumed an effective annualized deflator of 2.38%. During the same quarter (October 2017 through December 2017) the inflation recorded by the Bureau of Labor Statistics (BLS) in their CPI-U index was a similar but somewhat higher 2.61%. Underestimating inflation results in optimistic growth rates, and if the BEA's "nominal" data was deflated using CPI-U inflation information the headline growth number would have been slightly lower at a +2.37% annualized growth rate.
Among the notable items in the report :
-- The headline contribution from consumer expenditures for goods was reported to be substantially stronger at +1.76% (up +0.79% from the prior quarter).
-- The contribution to the headline from consumer spending on services also improved materially, up +0.30% to +0.82%. The combined consumer contribution to the headline number was +2.58%, up a significant +1.09% from 3Q-2017.
-- The headline contribution from commercial private fixed investments more than tripled to +1.27%, up +0.87% from the prior quarter.
-- Inventories reversed their contribution to the headline number, subtracting -0.67% after adding +0.79% in the prior quarter (a swing of -1.46%). It is important to remember that the BEA's inventory numbers are exceptionally noisy (and susceptible to significant distortions/anomalies caused by commodity price or currency swings) while ultimately representing a zero reverting (and long-term essentially zero-sum) series.
-- Governmental spending added a surprising +0.50% to the headline number, the highest growth rate since the 2nd quarter of 2015.
-- Exports contributed +0.82% to the headline number, up +0.57% from the prior quarter.
-- Imports subtracted -1.96% from the headline number, a drop of over two percent (-2.07%) from the prior quarter. In aggregate, foreign trade subtracted -1.14% from the headline number.
-- The "real final sales of domestic product" grew at an annualized 3.21%, up +0.84% from the prior quarter. This is the BEA's "bottom line" measurement of the economy and it excludes the inventory data.
-- As mentioned above, real per-capita annual disposable was down -$12 per annum from the previously reported 3rd quarter number. At the same time the household savings rate was reported to have dropped to 2.6% (down -0.7% from the prior quarter and down a full percent from 2Q-2017). As always, it is important to keep this line item in perspective: real per-capita annual disposable income is up only +6.91% in aggregate since the second quarter of 2008 -- a meager annualized +0.71% growth rate over the past 38 quarters.
The Numbers
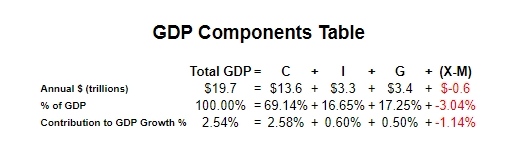
As a quick reminder, the classic definition of the GDP can be summarized with the following equation :
GDP = private consumption + gross private investment + government spending + (exports - imports)
or, as it is commonly expressed in algebraic shorthand :
GDP = C + I + G + (X-M)
In the new report the values for that equation (total dollars, percentage of the total GDP, and contribution to the final percentage growth number) are as follows :
The quarter-to-quarter changes in the contributions that various components make to the overall GDP can be best understood from the table below, which breaks out the component contributions in more detail and over time. In the table below we have split the "C" component into goods and services, split the "I" component into fixed investment and inventories, separated exports from imports, added a line for the BEA's "Real Final Sales of Domestic Product" and listed the quarters in columns with the most current to the left :
Summary and Commentary
This report is a shockingly mixed bag. Consumers contributed more than the net headline number, with poor showings by inventories and imports more than offsetting material growth in fixed investments, exports and government spending. The notable takeaways from this report are :
-- Imports surged, even as the dollar weakened. Exports simultaneously increased materially. Clearly, currency movement is not the only thing happening in the foreign trade arena.
-- Inventories once again wreaked havoc upon the headline number. What inventories gave last quarter they took away this quarter.
-- The big story, however, was household disposable income. And noteworthy was the fact that the 3rd quarter numbers were quietly revised sharply downward. But the real shocker was that household savings rates dropped below those last seen at the brink of the "Great Recession." All of the surge in consumer spending came from savings, not paychecks -- meaning that the surge is simply not sustainable.
This report is more troubling upon reflection than the +2.54% headline might suggest. Although the headline is sort of in the "Goldilocks" zone for US economic growth, having household income and the savings rate remind us of the summer of 2007 is unsettling at best.
Disclosure: None


