
BEA Estimates 2nd Quarter 2018 GDP Growth At 4.07%
In their first ("Advance") estimate of the US GDP for the second quarter of 2018, the Bureau of Economic Analysis (BEA) reported that the US economy was growing at a +4.07% annual rate, up a significant +1.85% from a revised prior quarter.
In this report, the BEA also performed their annual revisions to previous quarters, this time dating back to 1929. The average quarterly revision to the headline number for the past four quarters was downward and material at -0.19%, while the average quarterly revision for the headline over the period dating back to the beginning of 2008 was much smaller at -0.03%.
That small average revision masks the nature and volatility of the revisions. The standard deviation of the headline number's revisions dating back to 2008 was 0.46%, indicating that although over the long term the growth measurements were generally accurate, significant portions of that growth were initially misallocated at a quarterly level. The bulk of the revisions consisted of moving material amounts of the growth from one quarter to another.
During the second quarter of 2018, the growth rate for total consumer spending was reported to be +2.70%, up +2.34% from the revised prior quarter. Inventories contracted by -1.00%, while the growth rate in commercial fixed investment rose by a nearly offsetting +0.94%. Exports strengthened by +1.12% while imports weakened -- subtracting only -0.06% from the headline number.
Previously reported household income data was also extensively revised. Real annualized household disposable income increased by $205 per annum (in 2012 dollars), and the household savings rate was revised sharply upward to 6.8%.
For this revision, the BEA assumed an effective annualized deflator of 3.21%. During the same quarter (April 2018 through June 2018) the inflation recorded by the Bureau of Labor Statistics (BLS) in their CPI-U index was significantly lower at 2.26%. Overestimating inflation results in pessimistic growth rates, and if the BEA's "nominal" data was deflated using CPI-U inflation information the headline growth number would have been much higher at a +5.16% annualized growth rate.
Among the notable items in the report :
-- Consumer expenditures for goods grew at a +1.24% annualized rate (up +1.37% from a revised prior quarter).
-- The contribution to the headline from consumer spending on services increased +0.97% to +1.46%. The combined consumer contribution to the headline number was +2.70%, up +2.34% from a revised 1Q-2018.
-- The headline contribution from commercial private fixed investments was +0.94%, down -0.40% from the prior quarter.
-- Inventories subtracted -1.00% from the headline number. It is important to remember that the BEA's inventory numbers are exceptionally noisy (and susceptible to significant distortions/anomalies caused by commodity price or currency swings) while ultimately representing a zero reverting (and long term essentially zero sum) series.
-- The growth in governmental spending added +0.37% to the headline number, up +0.10% from a revised prior quarter.
-- Exports contributed +1.12% to the headline number, up +0.69% from the prior quarter.
-- Imports subtracted only -0.06% from the headline number, up +0.39% from the prior quarter. In aggregate, foreign trade added +1.06% to the headline number.
-- The "real final sales of domestic product" growth was a very healthy +5.07%, up a substantial +3.12% from a revised prior quarter. This is the BEA's "bottom line" measurement of the economy and it excludes the inventory data.
-- As mentioned above, real per-capita annual disposable was reported to have grown $205 quarter-to-quarter in this report. The household savings rate was reported to be 6.8%. Nearly all of the personal income numbers were revised (including the quarter-by-quarter household savings rates, which were nearly doubled in revision over the past two years), and the reporting was shifted from chained 2009 dollars to 2012 dollars.
The Numbers, Nearly All Revised
As a quick reminder, the classic definition of the GDP can be summarized with the following equation :
GDP = private consumption + gross private investment + government spending + (exports - imports)
or, as it is commonly expressed in algebraic shorthand :
GDP = C + I + G + (X-M)
In the new report the values for that equation (total dollars, percentage of the total GDP, and contribution to the final percentage growth number) are as follows :
GDP Components Table

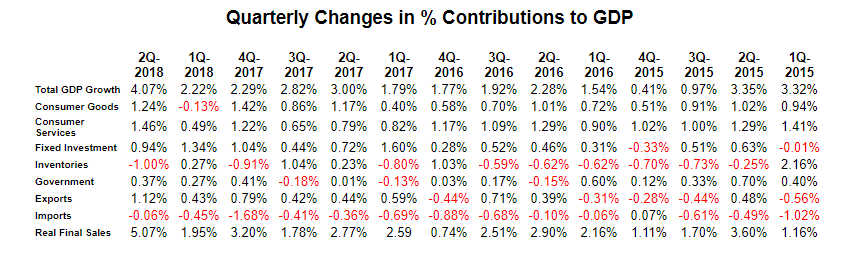
The quarter-to-quarter changes in the contributions that various components make to the overall GDP can be best understood from the table below, which breaks out the component contributions in more detail and over time. In the table below we have split the "C" component into goods and services, split the "I" component into fixed investment and inventories, separated exports from imports, added a line for the BEA's "Real Final Sales of Domestic Product" and listed the quarters in columns with the most current to the left :
Summary and Commentary
A headline number showing +4.07% growth makes us want to break into a boisterous refrain of "Happy Days are Here Again." Some will undoubtedly claim that the "Tax Cuts and Jobs Act of 2017" is making America great again. And the BEA's own "bottom line" Real Final Sales growth was reported to be +5.07% -- a number that some might consider to be unsustainably high or an early indication of an overheating economy. At minimum, it signals that the Fed's accommodations over the past decade are no longer needed.
One cautionary point should be made for the data geeks: in a number of cases (particularly household savings rates) the revisions were substantial enough that they materially changed our understanding of how the historical economy was behaving. As a glaring example, the household savings rates since 2012 were substantially increased -- including an essential doubling of the savings rates for the prior four quarters. These kind of revisions suggest major methodology changes that can make historical comparisons problematic.
While we are pleased to find the economy growing far faster than we had previously expected, the historical revisions leave us with a sense of unease.
Disclosure: None.


