
Bakken Production Per Well Continues To Improve
North Dakota operators could see a boost in valuations going into driving season. We continued to see improved production per well. Costs shoud decrease with improved logistics with the start of the DAPL. Breakevens should continue to improve, especially for the operators below:
|
Name |
Well Count |
CUM Gas (NYSEMKT:MCF) |
CUM Oil (NYSE:BBL) |
CUM Water |
|
HESS (NYSE:HES) |
65 |
9,429,215 |
5,335,798 |
2,560,956 |
|
XTO ENERGY INC. |
60 |
7,155,134 |
4,204,515 |
3,362,865 |
|
BURLINGTON RESOURCES |
24 |
2,322,301 |
2,225,848 |
1,219,159 |
|
SM ENERGY CO (NYSE:SM) |
23 |
1,453,508 |
1,245,981 |
2,331,071 |
|
Statoil Oil & Gas LP (NYSE:STO) |
22 |
3,221,719 |
1,962,554 |
1,762,885 |
|
QEP ENERGY (NYSE:QEP) |
20 |
3,582,825 |
1,969,575 |
2,238,905 |
|
OASIS PETROLEUM (NYSE:OAS) |
17 |
3,030,089 |
2,029,745 |
3,831,637 |
|
EOG RESOURCES (NYSE:EOG) |
16 |
1,257,113 |
1,956,189 |
1,748,355 |
|
ENERPLUS (NYSE:ERF) |
15 |
1,974,533 |
1,987,065 |
1,455,869 |
|
MARATHON OIL (NYSE:MRO) |
13 |
2,175,320 |
1,770,594 |
1,163,321 |
|
NEWFIELD (NYSE:NFX) |
12 |
3,380,270 |
1,445,806 |
425,480 |
|
WHITING (NYSE:WLL) |
12 |
2,302,302 |
1,464,559 |
2,118,686 |
|
PETRO-HUNT, L.L.C. |
9 |
617,259 |
614,834 |
738,119 |
|
WPX ENERGY (NYSE:WPX) |
8 |
1,350,744 |
1,469,854 |
1,112,585 |
|
LIBERTY RESOURCES |
7 |
1,111,318 |
631,949 |
1,300,810 |
|
ABRAXAS (NASDAQ:AXAS) |
6 |
1,144,111 |
495,755 |
431,719 |
|
HRC OPERATING (NYSE:HK) |
6 |
1,318,492 |
848,139 |
772,518 |
|
CONTINENTAL (NYSE:CLR) |
5 |
309,226 |
220,400 |
415,040 |
|
CRESCENT POINT |
4 |
143,652 |
335,176 |
321,596 |
|
SLAWSON |
3 |
178,478 |
235,221 |
146,870 |
|
Total |
347 |
47,457,609 |
32,449,557 |
29,458,446 |
(Source: Welldatabase.com)
The above table shows all wells completed and turned to sales in 2016.
The graph below shows the 3-year type curve for all 2014 horizontal wells. The black line represents well number, while red is natural gas, green is oil and blue is water production. The grey line on the bottom represents BOE.
2014
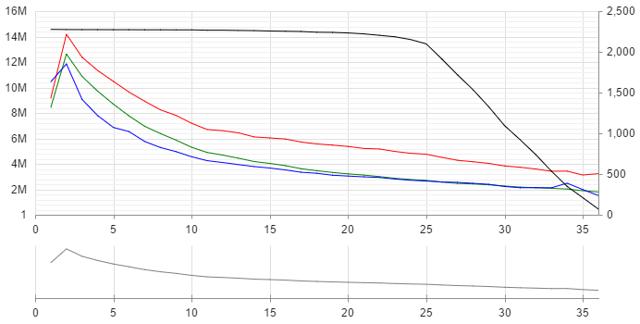
Source: Welldatabase.com
In 2014, there is a relatively large decline over the first 12 months. This decreases after this time frame, until it steadies some in the third year. An average of 92K BO over the first 12 months is realized.
The 2015 type curve shows much better initial production. Decline rates improved, when we consider the average GOR.
2015
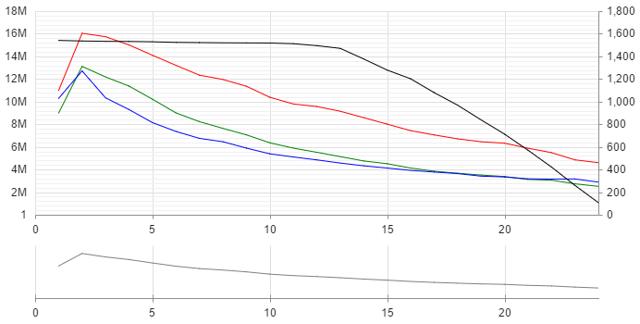
Source: Welldatabase.com
2015 wells produced 13K more barrels of oil and 38K Mcf of natural gas over 12 months.
In 2016, wells improved by another 8K BO and 22K Mcf. The two-year improvement is 21K BO and 60K Mcf. The decline curve improves more.
2016
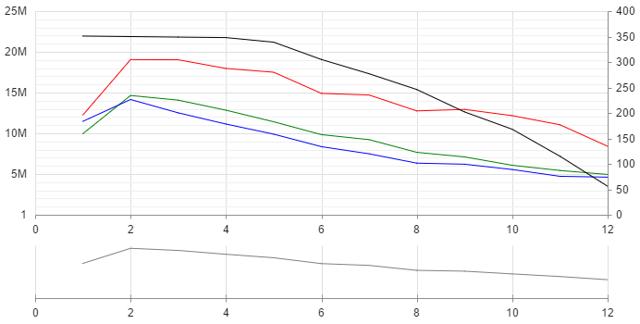
Source: Welldatabase.com
In 2016, 15 wells produced over 200K BO. Many of these locations reached this in under 10 months. One well produced over 250K BO.
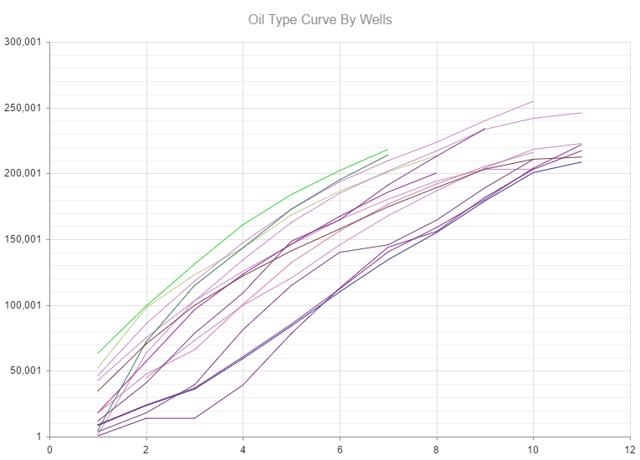
Source: Welldatabase.com
There are several locations that model over 250K BO in the first 12 months, and it is possible one or more could see 300K BO.
Many of the Bakken operators have seen valuations decrease significantly over the past few months. There are several we like in the short term based on the assumption oil prices will rise during the driving season. Longer term these investments may be too volatile and risky for the average investor, but it is possible the recent pullback provided an opportunity.
Disclosure: Data for the above article is provided by welldatabase.com. This article is limited to the dissemination of general information pertaining to its advisory services, together with access ...
more

