
Bad Math In The Investment Industry
When I was still in graduate school, I regularly taught courses in statistics at the University of Illinois’ business school in Chicago. I’ve also taught it a couple of times since then.
Each time, I tried to teach the students something that apparently is very unusual.
I taught them that they shouldn’t get too hung up on the formulas. Much more important is to think about where the data will come from. If the input data isn’t any good, don’t bother with the formulas because the output will be nonsense.

I also told them to think about whether the assumptions of the formulas were true, or nearly so at least, in the world to which they would be applied. If they weren’t, again, don’t bother.
Many didn’t listen. It was all about the formulas. Whatever I said, they assumed they would be graded on whether they knew the formulas. They were sweating bullets about it.
So, of course, they didn’t learn the lesson. But, it’s the most important lesson. If you wield formulas like a hammer that thinks everything is a nail, you’re going to get a lot of idiotic results.
All too often people decide to use a formula first and then think about where to get the data. If the data are no good at all, they’re still stuck with the decision to use the formula.
After graduate school, I got my first real job at a brokerage firm. Because I was a mathematician, they sent me to conferences on quantitative research in finance. Here was my impression.
I wondered why these people, the academics and in-house researchers who gave the presentations and wrote the papers, why these people didn’t decide whether they wanted to be pure mathematicians on the one hand or practitioners on the other.
If they wanted to be mathematicians, they’d have to do much better math. But, if they wanted to be practitioners, they were using math for applications that the math didn’t really fit, that didn’t need it and that didn’t benefit from it.
After a while, I realized what was going on. It was incredible that the people at these conferences — “quants,” as they’re called — seemed unconscious of it.
The math was not real math, the kind you need to send a rocket to the moon or to build a bridge. This was “sales math.” The very fact that you used math helped your firm’s sales pitch. It didn’t matter that you didn’t need it or that it wasn’t done right. Who was checking? You used it to impress the clients.
When your clients are impressed, you are impressed with yourself, even if impressing the clients involves misleading them. The quants were impressed with themselves because they were an integral part of the lucrative marketing machine.
Michael Lewis summed it up concisely in his book “The Big Short”: “It’s too much to expect the people who run big Wall Street firms to speak in plain English since so much of their livelihood depends on people believing that what they do cannot be translated into plain English.”
The quants are co-conspirators in this breach of commonsense communication. They help make people believe that what their firms do cannot be translated into plain English. In fact, a lot of what their firms do, they do because it can’t be translated into plain English. The quants and their bosses would argue that it’s to diversify risk and so on, but the financial crisis showed us what a delusion that is. Its effective purpose is to hide, rather than disclose, information.
In my book about the investment industry, “The Big Investment Lie,” I said, “sauntering through the expensive, glossy outputs of the professional investment field, you may glimpse arcane, sophisticated-sounding articles, suggesting the discourses of an elite corps of exquisitely knowledgeable experts. ... Yet, in spite of the self-serving message trumpeted both to insiders and outsiders by these arcana ‘we insiders are smart and extraordinarily capable,’ the actual fact is that professional investors do not do better than the random investment picks of a gaggle of monkeys.”[1][i] Overwhelming evidence proves this statement to be true.
Not only that, but the professionals can cause havoc for the economy in the process.
TWO MATH-BASED SCAMS
In this commentary, I’ll describe two instances of how mathematics is used to impress and befuddle clients and to extract exorbitant fees.
I’ll start with what I call the “asset allocation” scam because it’s more likely ordinary investors will encounter it directly. Then I’ll get to the second instance, the one that contributed to the 2007-2009 financial crisis.
Asset allocation is a term that is unfortunate because it can have many meanings. To good investment advisers with integrity, it chiefly means a long-term decision about how to divide a portfolio between stocks and bonds. To investors who think they can time the market, despite all the evidence to the contrary, it means nearly the opposite — changing their allocation constantly in the short run to try to take advantage of trends they think they see coming.
But, to the sales-math guys, the term is golden.
In the early 1950s researcher Harry Markowitz published a mathematical technique in technical journals. If it had only been the math, it would have passed quietly into the archives. It was the application that counted. It won him a Nobel Prize in economics almost four decades later.
Like a lot of mathematics in economics, it was merely an attempt to give more precise expression to an old saw, or a simple principle.
In this case the old saw was “don’t put all your eggs in one basket.” The mathematics confirmed that if you put your eggs in different baskets, you’ll probably get as good a result, but you won’t take as much risk.
To be specific, Markowitz was dealing with shares of stock. He argued that it was better to buy a lot of stocks than just one or a few. The mathematics involved three concepts that are common in probability and statistics: “expected value,” “variance” and “correlation.”
If you buy a lot of stocks, your expected value (your expected return on investment) will be as good as if you buy only one. But the variance (the uncertainty about the return) will be less. Why will it be less? Because the stocks are not perfectly correlated.
Markowitz’s calculation method implied that if your portfolio had the right amounts of the right stocks, you could use his calculation to minimize the variance and, therefore, by implication, the risk. But, you needed to know all the correlations between the stocks.
Markowitz’s “mean variance optimization” method spawned an industry of portfolio optimizers. There were about 6,000 stocks, which meant 6,000 variances, 6,000 expected returns, and about 18 million correlations. You needed to get estimates of all those and feed them into the mean-variance-optimization algorithm. And, there are at least a dozen different ways you could make the estimates.
Remember what I said about not bothering with a formula if the inputs aren’t going to be any good? That advice was ignored for the 10,000th time. People went about trying to estimate all those correlations and variances, using historical data to make their estimates.
When they fed those estimates into the mean-variance-optimization algorithm, they got crazy results. The results might tell you to invest all your money in one or just a couple of stocks, despite the principle of not putting your eggs in one basket that the math was supposed to prove.
Even if you reduce the problem to less correlations and variances by using a much smaller number of “asset classes” instead of individual stocks (as people do now) you still get crazy results, such as that you should invest everything in emerging markets.
So, what can you do if you’re a quantitative researcher and it’s your job to use “sophisticated technology” to find the optimum portfolio? You jimmy the inputs. You keep jimmying them until you get outputs that look reasonable. In short, you don’t really use the technology at all because you rig the inputs to get whatever results you thought would look OK to the client or to your boss.
IT GETS WORSE
But, that’s not the scam I’m talking about. The scam has been refined over time and it is now a thing of beauty.
Here’s an example I saw recently in a variable annuity. To take advantage of an attractive-looking rider, which steps up your “guaranteed base” by 6 percent a year, you have to agree to have your portfolio selected by the annuity provider using “Nobel Prize-winning technology.” This Nobel Prize-winning technology allocates your portfolio to no less than 25 mutual funds, charging an average of 2 percent a year in fees, including trading commissions. Two percent a year means you hand over half your portfolio’s value in fees to your advisers over 25 years.
So, what do you get for those fees? You get a portfolio that is exactly the same as an index fund. That’s because Markowitz-style optimization tends to give you a portfolio that mimics the whole market, as an index fund does. An index fund can be had for less than one-twentieth of those fees.
So, the sales math costs the client 20 times what the client should be paying. Everyone involved in the scam feels very important because they’re making so much money from client fees, and the (misled) client is so well-satisfied because of the cunning sales pitch. And, as with peer-to-peer pirated downloads, nobody in particular can be found guilty of the fraud.
THE CDO SCAM
The pattern is similar for the math that was used to justify selling packages of bad mortgages and other debt to risk-averse investors. In this instance, ratings agencies and banks used a formula that magically transformed loans to a bunch of subprime borrowers (low- or no-credit-rating borrowers) into high-quality loans.
The first step in the pattern is someone derives a formula that seems “elegant” to the quasi-mathematicians and pseudo-mathematicians who populate the quant field.
It is presented to the quants’ bosses (quants are not usually the top decision-makers) as an elegant simplifying procedure that could save the firm money and reinforce an argument for one of the firm’s products that the firm had been trying to make less elegantly.
The procedure is adopted on the blithe assumption that the input data it requires can be obtained and will be meaningful. Then, because it is now a given that the formula will be used, whatever input data can be scraped up or estimated will have to do. The quants even feel a surge of pride when they find a better way to estimate the required inputs, even if it’s still a poor estimate.
To elucidate the pattern as applied to collateralized debt obligations, I’ll first explain briefly how CDOs are structured. The CDOs that caused the worst problems were bundles of “no-doc” loans — mortgages given to people who did not have to provide evidence that they could repay.
Suppose 10,000 mortgages are bundled into a pool. The key to creating a CDO is tranching. The pool is divided into, let us say, four slices, or tranches, with the names, ranging in quality from highest to lowest, “super senior,” “senior,” “mezzanine” and “equity.” The revenues from the mortgage payments are divided among the four tranches as follows:
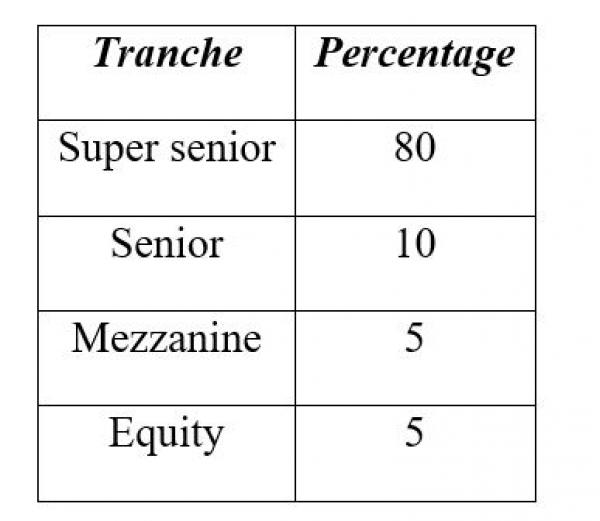
Now, the key is that the holders of the tranches don’t divide the revenues equally; rather, there is a seniority structure. The super-senior tranche holders get the first 80 percent of the revenues before the other tranche holders get anything. The senior tranche holders get the next 10 percent before the mezzanine and equity tranche holders get anything, and so on.
The super-senior tranche, and sometimes the senior tranche as well, was typically rated AAA (top quality) because it was assumed that at least 80 percent (or 75 percent, or whatever portion went to the super-senior tranche holders) of the promised revenue was sure to come in, and the super-senior tranche would get it all.
But, if you looked at any of the subprime borrowers to whom the mortgages were given, you’d think the probability that he or she would repay was considerably less than 80 percent. That’s where “correlation” comes in. No problem, you haven’t put all your eggs in one basket. You’ve put them in 10,000 baskets. If one borrower doesn’t repay, others will.
The big question is, how correlated are they? If they’re all highly correlated, if one doesn’t repay, neither will the others. But, if they’re not highly correlated, if one doesn’t pay, others will.
The banks and ratings agencies were selling these CDOs hand over fist with high profits. The sales math was working wonders. But, that meant there wasn’t enough time to do a detailed evaluation of each. No way was there enough time to second-guess the quality of each and every loan in a 10,000-loan package. Time to haul in statistical formulas, which can assess the probability of the aggregate without knowing any specifics!
That is, if the formula and the data are any good.
The standard formula used to evaluate the probability of default on the senior tranches was the “one-factor Gaussian copula” model. This was the gee-whiz formula (gee-whiz to a quasi-mathematician) that enthralled the structured credit finance industry.
The model had the disadvantage that, as with the Markowitz model, you have to estimate the inputs: the probability that any individual mortgagee will default, and the correlations between default probabilities. Estimation is difficult and crude.
Both the method of estimating the probability that any individual investor would default and the correlations between default probabilities were deeply flawed. The probability that any individual investor would default was estimated from historical default rates. But mortgages were now being given based on much more lenient financial qualifications than in the past, so past default rates didn’t apply.
The method of estimating correlations had a different problem. The chief method used to do the estimating tends to please quants because it is arcane and rests on the same simplified model of a highly efficient market that is crucial to all their formulas. It was based on the market value of CDOs and other such issues themselves – and so if those were overvalued then the correlations derived from them would reflect that overvaluation. This led to a positive feedback loop in which too-high valuations led to implied correlations that were too low, which led to too-high valuations by the ratings agencies.
You get different estimates for different tranches, depending on how you do it and on what data you use. You’d get as good an answer by just using your intuition without bothering with all the calculation. And, that’s just to get the inputs to the arcane calculation — which also rests on the same oversimplified model of a highly efficient market. (Quants agree it is oversimplified.)
But, the difficulty of estimation can be turned to advantage when you’re doing sales math. If one estimator of the inputs tells you that your CDO doesn’t merit a top-quality rating, you can go back to the computer and try different estimators until you find one that tells you it does.
In short, you jimmy the inputs until you get the output you want. This was done (not too surprisingly) to get top-quality ratings for CDOs. Why not, when everybody is making so much money on them? (The ratings agencies were paid handsomely by the banks, both for their ratings and to advise the banks on how to get high ratings.[i])
So-called “sophisticated” mathematics (or rather, the appearance of sophisticated mathematics) is grossly overused by the financial industry. It is used both to do a sales job (“we use the most sophisticated technology”) and for deniability (“all the models said that what actually happened had only a one-in-a-trillion chance of occurring”).
The biggest problem is that this degradation of mathematics worked on the industry’s investment clients and is still working. The best antidote would for the public to be much, much more skeptical of the industry, and for the industry to lose its hubris — especially the hubris that relies on using (or abusing) arcane mathematical models and inscrutable lingo — once and for all.
References
[i] Michael Edesess, The Big Investment Lie, 18 (Berrett-Koehler, 2007).
[ii] Elliot Blair Smith, Bringing Down Wall Street as Ratings Let Loose Subprime Scourge.


