
Back In The Box With The S&P 500
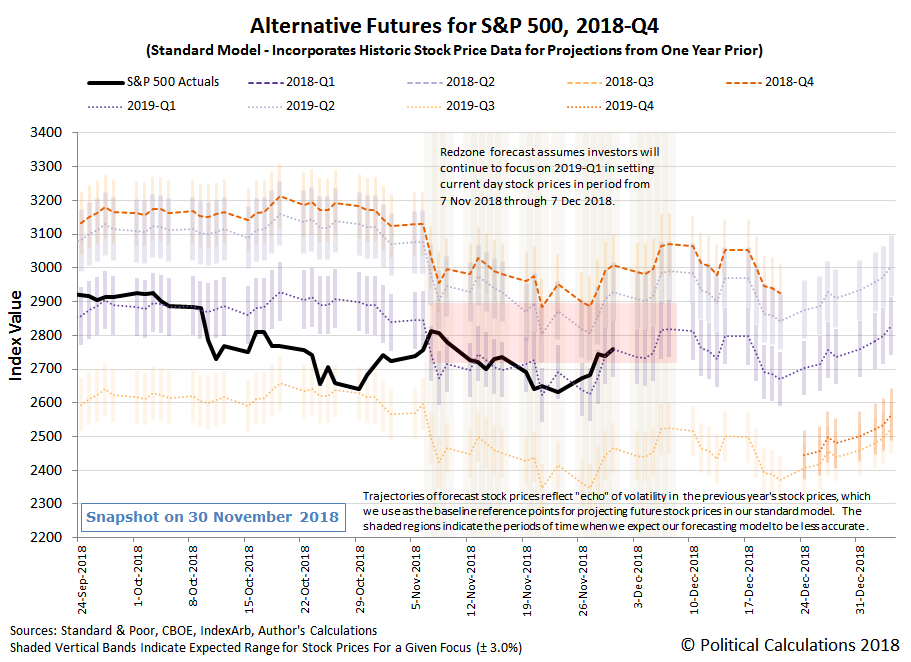
The fourth and final week of November 2018 saw the S&P 500 return back to the box, so to speak, as investors shifted their forward-looking attention back toward 2019-Q1 in setting current day stock prices.
The "box", of course, being the red-zone indicated in our spaghetti forecast chart that projects the level of the S&P 500 based on how far forward in time investors are looking....
(Click on image to enlarge)
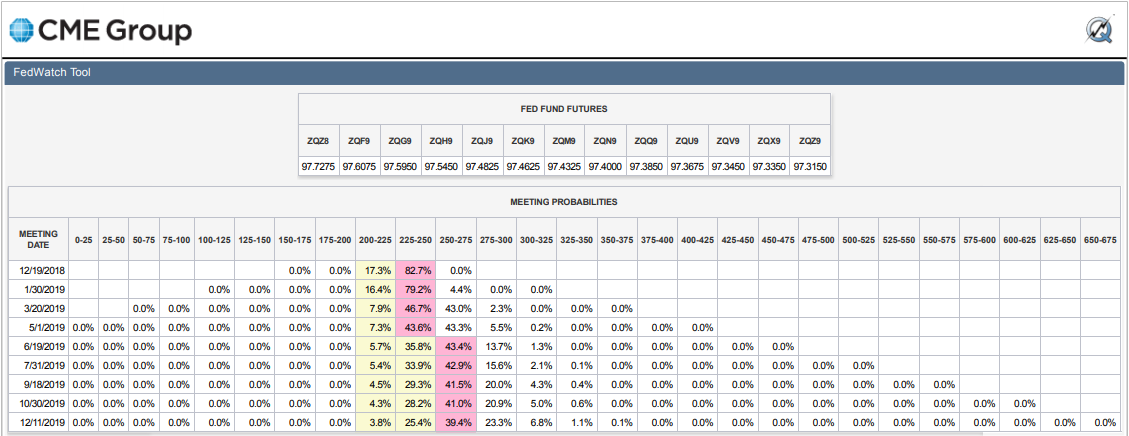
The big news of the week, which prompted the shift in the level of stock prices, was Federal Reserve Chair Jerome Powell's speech to the Economics Club of New York, which investors interpreted as his taking a much more dovish stance than he was indicating in previous weeks, where the Fed is now expected to back off on plans to continue its series of quarterly rate hikes well into 2019.
Instead, the CME Group's FedWatch Tool now indicates that after a quarter-point rate hike in December 2018, the Fed is now expected to raise short-term interest rates in the U.S. just once in 2019, at its June 2019 meeting. The following table shows the probabilities of rate hikes associated with upcoming FOMC meeting dates (please click the image for a larger version):
(Click on image to enlarge)
Looking back at the alternate futures chart for the S&P 500, it's pretty remarkable that the trajectory of the S&P 500 has more closely followed our dividend futures-based model's unadjusted forecast for investors focusing on 2019-Q1. That trajectory only exists because of the echo of the Lévy flight event that took place in early October 2018, without which, and without last week's reaction to Apple's bad news, our standard model's forecast for the S&P 500 with investors focused on 2019-Q1 would have more closely fit within the redzone forecast we added to the chart in early November.
Still, what neither we, nor anyone else, can do is to anticipate the specific news events that might prompt investors to suddenly shift their attention from one point of time in the future to another, which provides much of the genuine randomness that characterizes this portion of the volatility behind changes in stock prices. Speaking of which, here are the more noteworthy news headlines we identified in Week 4 of November 2018.
Monday, 26 November 2018
- Oil breaks above $60/bbl, but doubts about growth curb gains
- Wall Street rallies as Cyber Monday shoppers log on
- After the bell: Trump says he expects to raise China tariffs: Wall Street Journal
Tuesday, 27 November 2018
- Oil prices edge lower ahead of G20, OPEC meetings
- Fed wants smallest possible portfolio, says Vice Chair Clarida
- Wall Street reverses losses after White House adviser's trade remarks
Wednesday, 28 November 2018
- Oil falls below $60/bbl after 10th straight U.S. crude build
- U.S. new home sales drop to more than 2-1/2-year low
- Fed's Powell, in apparent dovish shift, says rates near neutral
- Wall Street jumps as Powell hints interest rate hikes may taper off
Thursday, 29 November 2018
- Oil rises as Russia indicates open to cuts with OPEC
- U.S., China exploring deal to delay more tariffs, start talks: WSJ
- Fed retunes message for 2019, opening door to 'slow down'
- Wall Street edges down as tech, bank stocks weigh
Friday, 30 November 2018
- Oil tumbles on supply glut; Wall Street up on G20 comments
- U.S., Canada, Mexico sign trade deal, Trump shrugs off Congress hurdle
- Wall Street rises on trade hopes; S&P, Nasdaq post best weeks in 7 years
After the Friday Close, Before the Monday Open
- China, U.S. declare 90-day halt to new tariffs: White House
- U.S., China agree trade war ceasefire after Trump, Xi summit
Over at The Big Picture, Barry Ritholtz has divided the week's major economy and market-related news into six positives and six negatives, covering the week through the market close on Friday, 30 November 2018. He does this every week as an exercise to minimize the effect that his biases may have in affecting his outlook in assessing investments, which is something that we recognize as a valuable service, because we use it for the same purpose. We're happy to feature it each week because it's valuable in maintaining an objective outlook that we find makes it easier to identify new opportunities sooner than we otherwise might, which is a bit like having a superpower.
How do you keep from getting trapped after a bias of yours sends you down a blind alley?
Disclaimer: Materials that are published by Political Calculations can provide visitors with free information and insights regarding the incentives created by the laws and policies described. ...
more

