Baby Boomer Employment Across Time - Thursday, July 12
With the release of the March employment report, let's review the status of the 20th century Baby Boom, which was one of the most powerful demographic events in the history of the United States. The chart below illustrates the 19-year surge in births following World War II that stretched from 1946 through 1964.

The boom in births is all the more remarkable when we view the births-to-population ratio. The ratio had dropped dramatically during the Great Depression, which made the post-war boom in births even more dramatic. The regression drawn through the series helps us better appreciate the magnitude of the boom and the subsequent drop in births during the "stagflation" era of the seventies and early 1980s.

Boomers in the Workplace
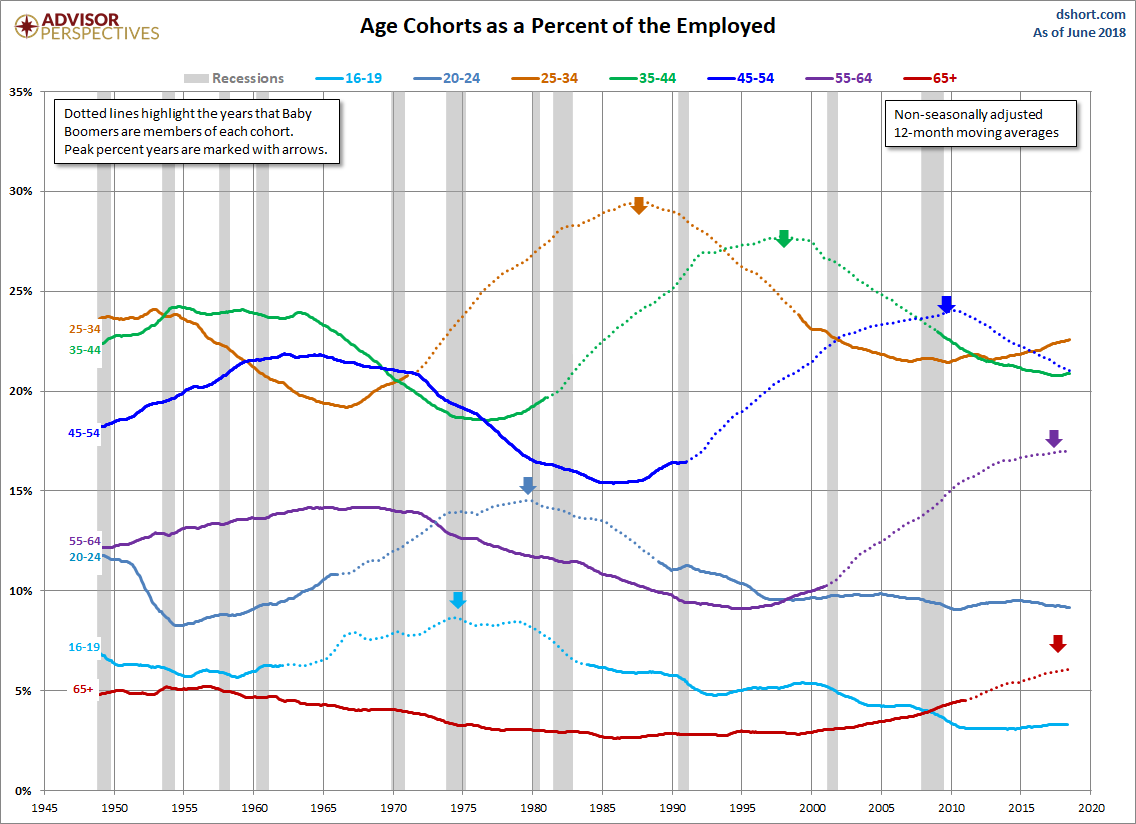
The series of charts below show seven age cohorts of the employed population from 1948 to the present. We've used the non-seasonally adjusted 12-month moving averages, hence the start date of 1949. We've highlighted the Boomer years for each cohort with dotted lines.
Note that the bottom of the vertical axis is fixed at zero on all charts. The top is fixed at 35% for the three prime work age cohorts 25-54. The younger and older cohort axes have been optimized for observation of the trends.
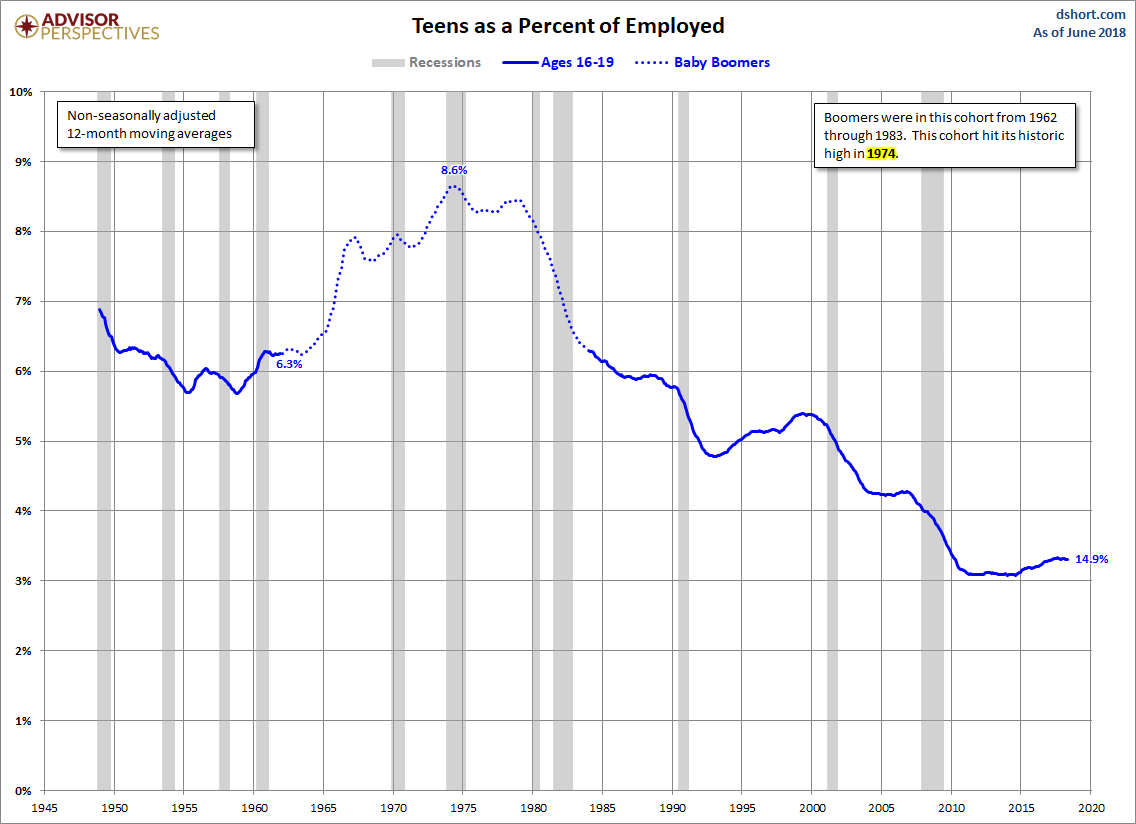
Our snapshot for the teenage years, ages 16-19, was occupied by the Boomers from 1962 through 1983. The trend peaked in 1974 at 8.6%.
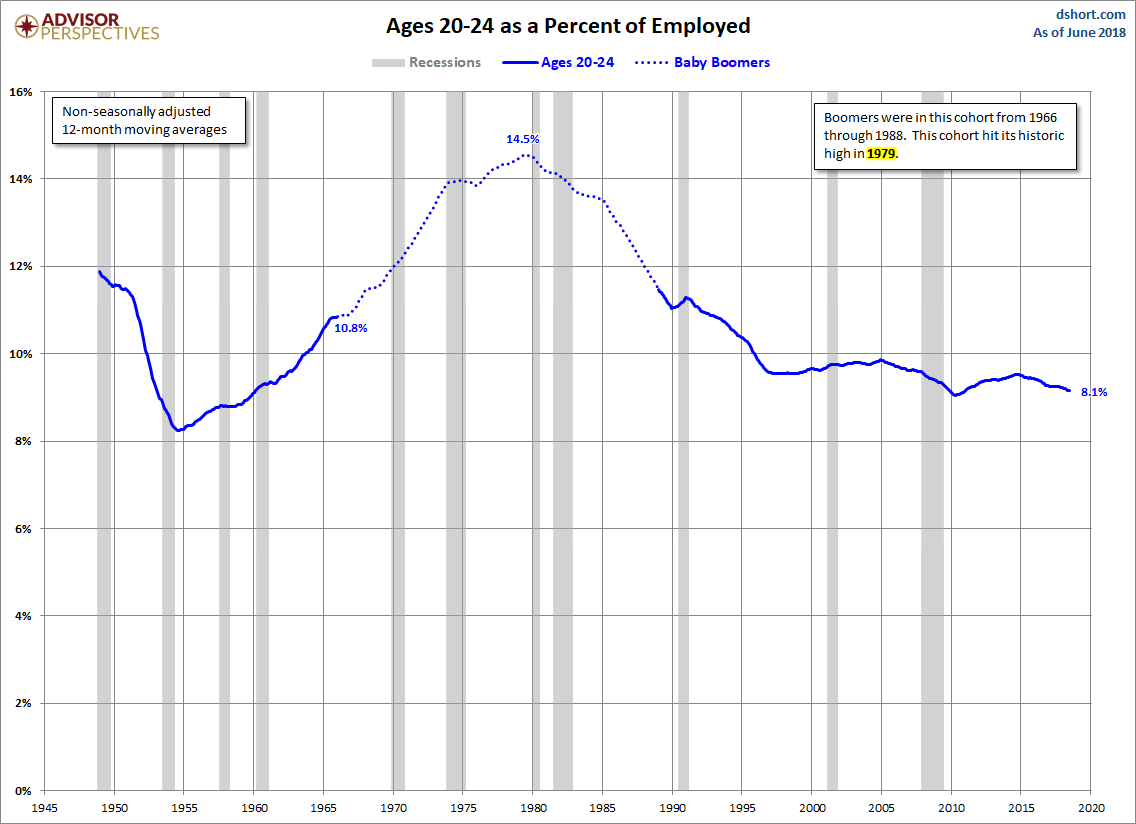
Ages 20-24, for many the college years, was the Boomer stronghold from 1966 through 1988. This cohort was hovering just below 11% of the employed population in 1965. The Boomer trend peaked in 1979 at 14.5%.
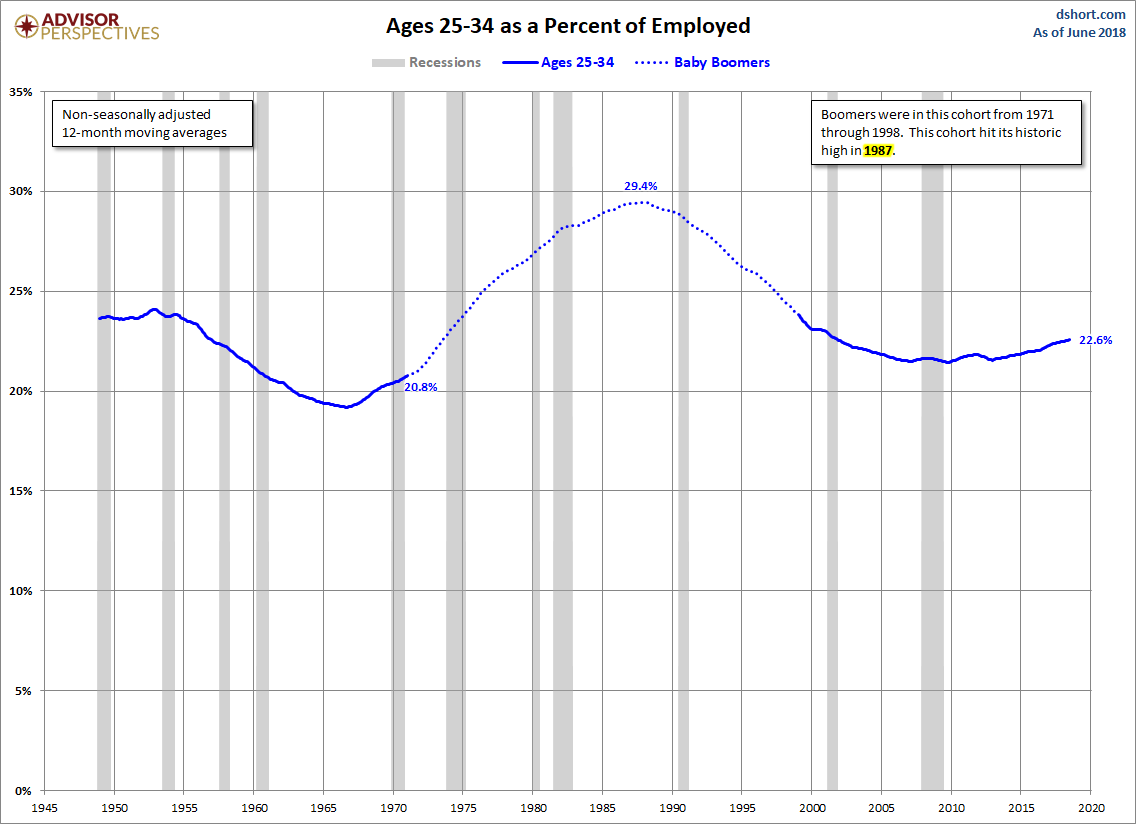
Ages 25-34, was the Boomer stronghold from 1971 through 1998. During the 11-month recession that began in December 1969, the employment percent for this cohort actually grew. It was around 20.8% of the employed when the Boomers began turning 25 and the growth trend peaked in 1987 at 29.4%.
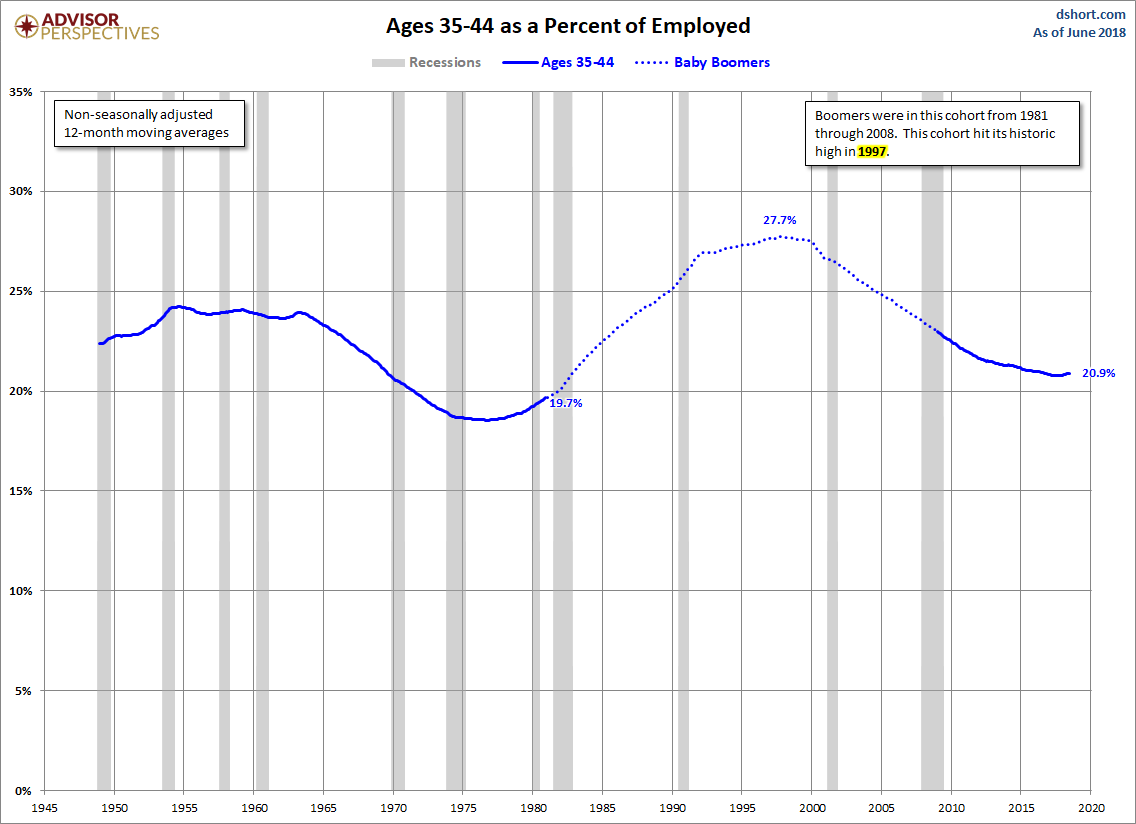
Ages 35-44 were Boomers from 1981 through 2008. This cohort accounted for 19.7% of the employed when the Boomers began turning 35 and peaked in 1997 at 27.7%.
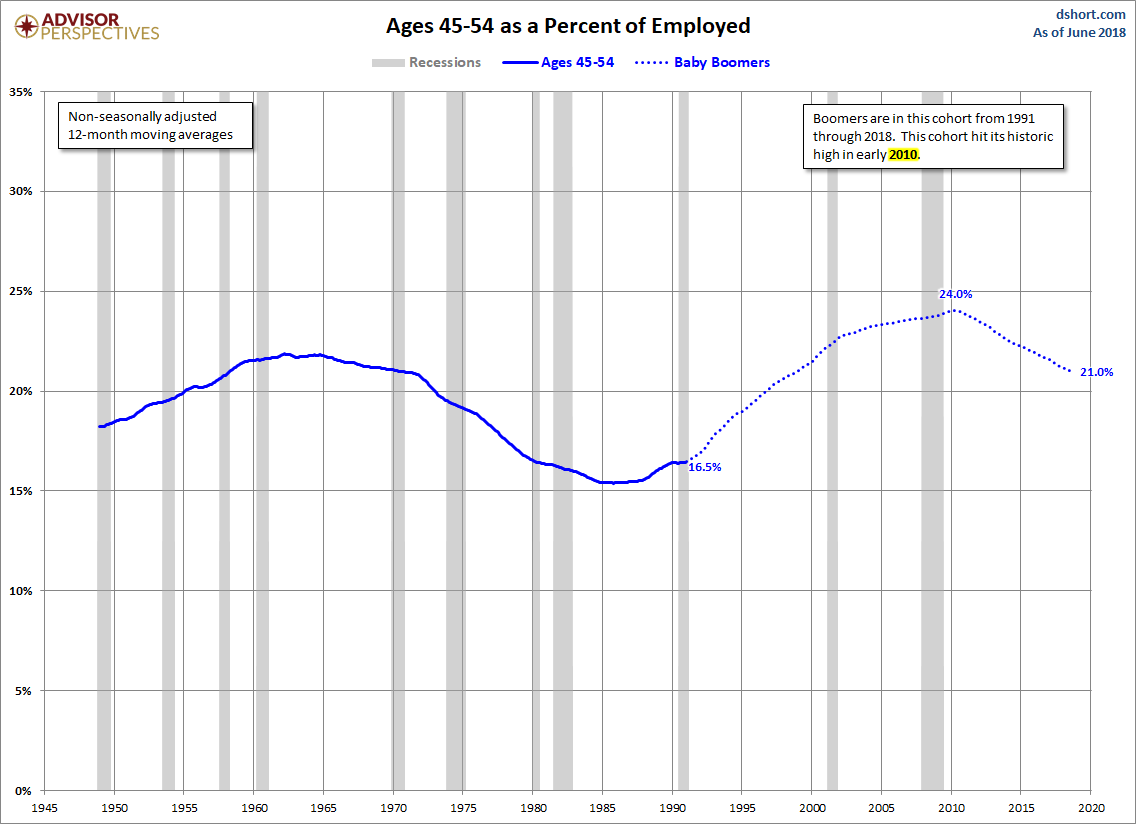
The Census Bureau's data shows us that the ages 45-54 have historically been the peak age for household incomes. Boomers have populated this cohort since 1991 and the youngest Boomers will be participants until 2018. Boomers began populating this cohort during the 8-month recession of 1990-1991 when this age group constituted 16.5% of the employed. It peaked at 24% in 2010 and has now fallen to 21.0%.
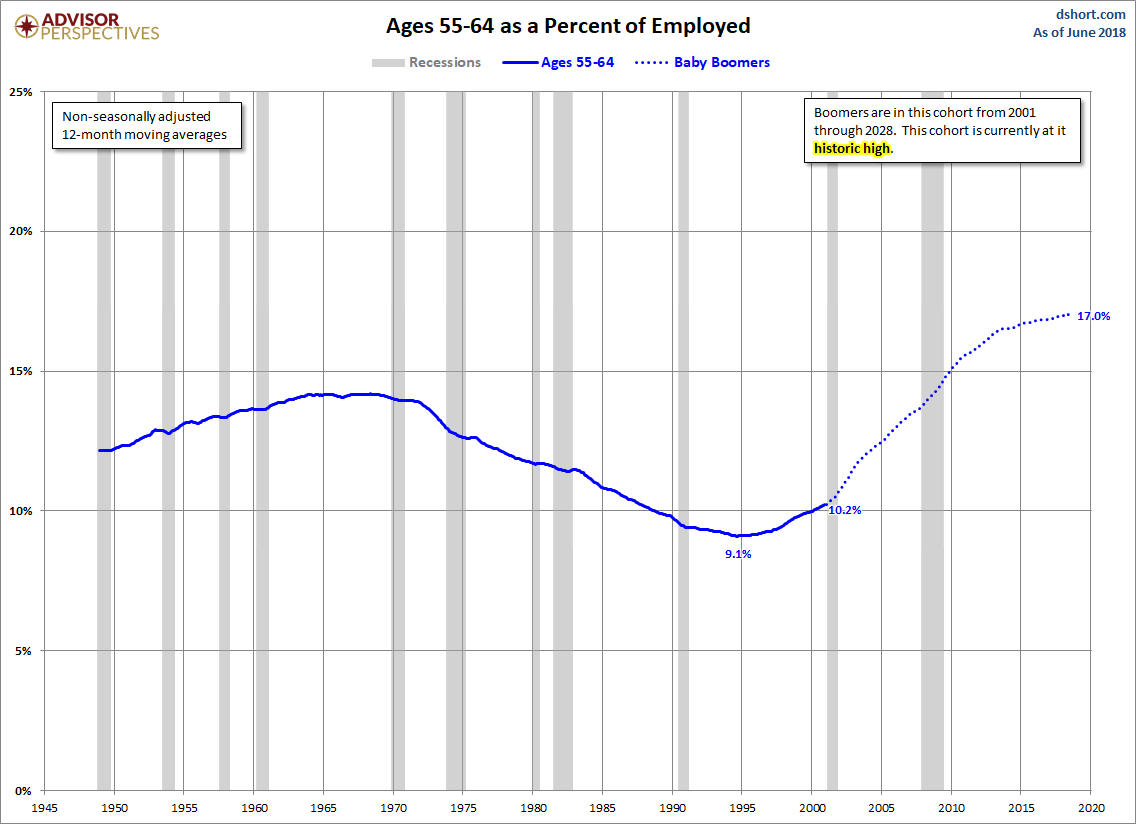
Boomers began entering the ranks of ages 55-64 in 2001 and will not exit until the end of 2028. This cohort accounted for 10.2% of the employed when the Boomers began turning 55 during the 2001 recession. The percentage has continued to rise and now stands at 17.0%.
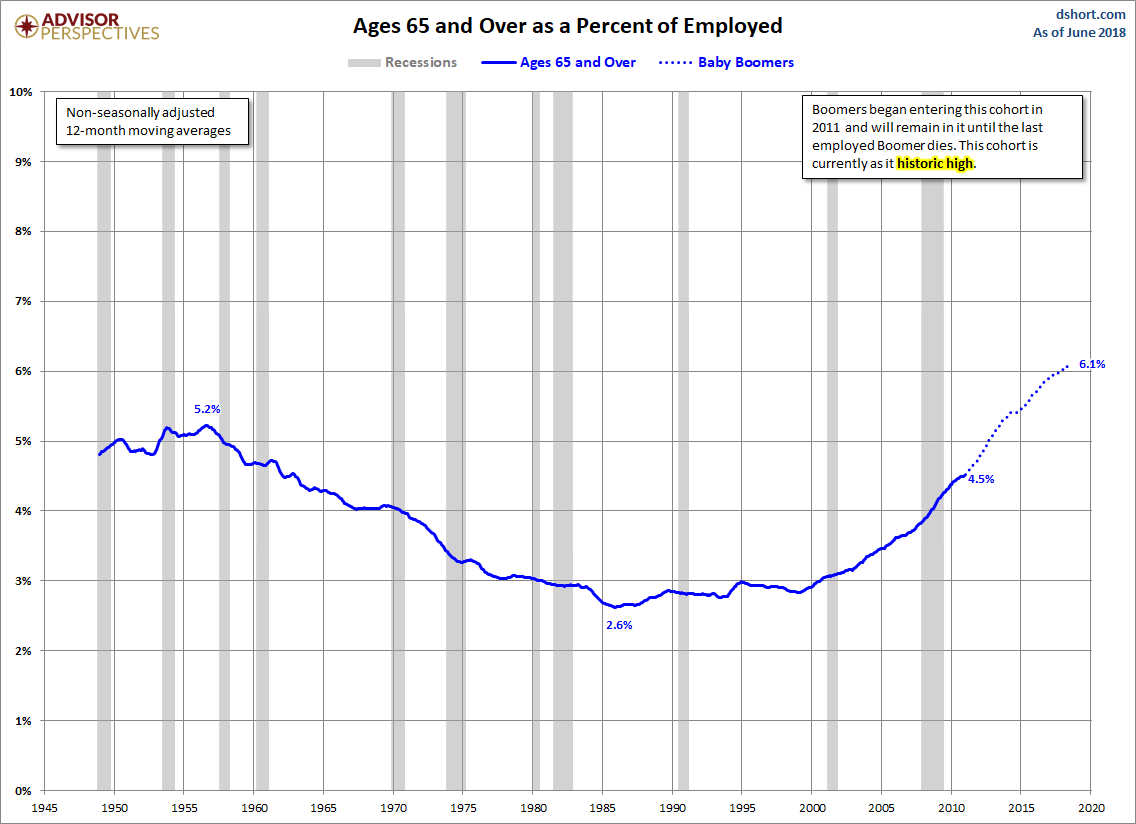
The senior employed, ages 65 and over, began being taken over by Boomers in 2011, and they won't depart from this cohort until the last employed Boomer dies. This cohort is currently at its historic high of 6.1%.
The Boomer Bulge Across Time
We'll conclude this retrospective with an overlay of the seven cohorts. What we see is essentially the "Boomer Bulge" in employment across time. Those born between 1946 and 1964 continue to grow the employment of the two oldest cohorts. It will be interesting to see how long those two trends continue.