
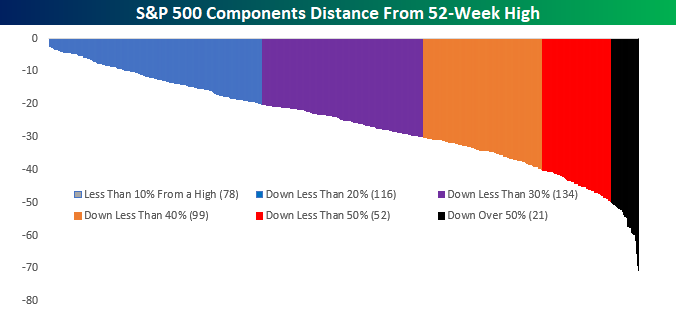
Average S&P 500 Stock Decline Exceeds 25%
The S&P 500 may not have reached bear market territory as an index yet, but of the 500 individual stocks in the index, more than 60% are down at least 20% from their 52-week highs. Overall, the average decline from a 52-week high is a staggering 25.7%! The chart below shows the distance each of the individual components is trading from their 52-week highs grouped by 10 percentage point ranges. As of Thursday afternoon, just 72 stocks in the S&P 500 are even trading with 10% of their 52-week high. Meanwhile, 82 stocks in the index are down 40% or more with 24 of those 82 stocks down by more than half! Have their been uglier periods for the stock market? You bet. But not in a long time.
So, which stocks are down the most? There are actually a number of well-known lists in that group with stocks like General Electric (GE), Western Digital (WDC), Nvidia (NVDA), Halliburton (HAL), Wynn Resorts (WYNN), Micron (MU), and Applied Materials (AMAT) all having been more than cut in half.
(Click on image to enlarge)
Disclaimer: To begin receiving both our technical and fundamental analysis of the natural gas market on a daily basis, and view our various models breaking down weather by natural gas demand ...
more

