
Average Hourly Pay And Benefits In The United States
The Bureau of Labor Statistics has been tracking the average pay and benefits earned by American workers in all occupations and working in all industries since at least the first quarter of 2004 [1], where we now have nearly 15 years worth of data that indicates how much the average civilian employee in the U.S. has been compensated for their hours worked.
We've visualized the nominal data reported by the BLS in the following chart, where we've presented the average wage or salary and the total benefits earned per hour worked with the combined total compensation earned by civilian workers in the U.S. from 2004-Q1 through 2018-Q3. The data for 2018-Q4 won't be available until 19 March 2019.
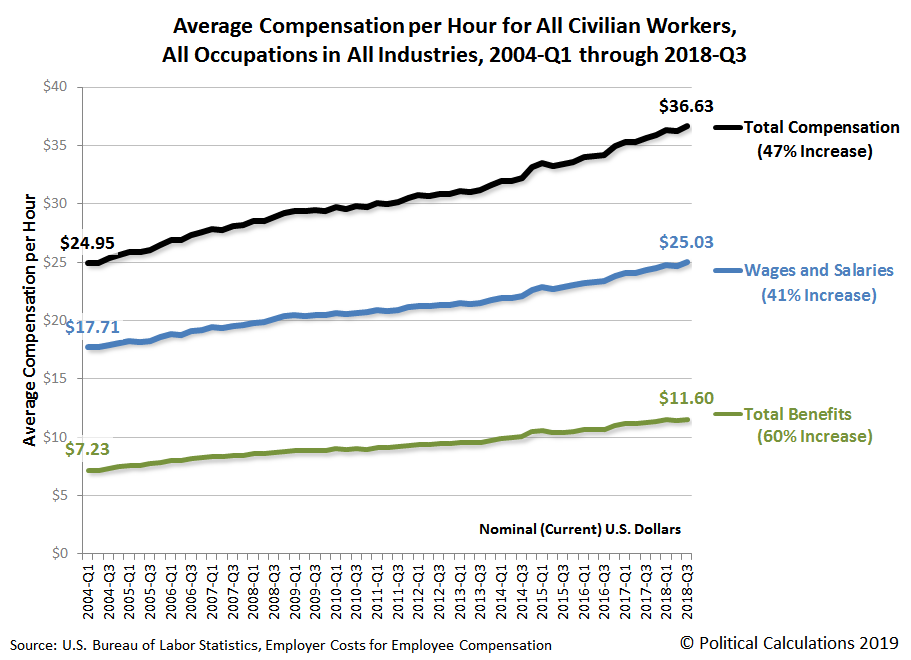
From 2004-Q1 to 2018-Q3, the cost to civilian employers in the U.S. of compensating their employees rose from $24.95 per hour to $36.63 per hour, an increase of 47%. Breaking that figure down into its components, hourly wages and salaries rose by 41% from $17.71 to $25.03 over that period, while the value of benefits paid to civilian employees as part of their total compensation rose by 60% from $7.23 to $11.60 per hour.
In our next chart, we're presenting the same quarterly information, but now adjusted for inflation to be in terms of constant 2018-Q3 U.S. dollars.
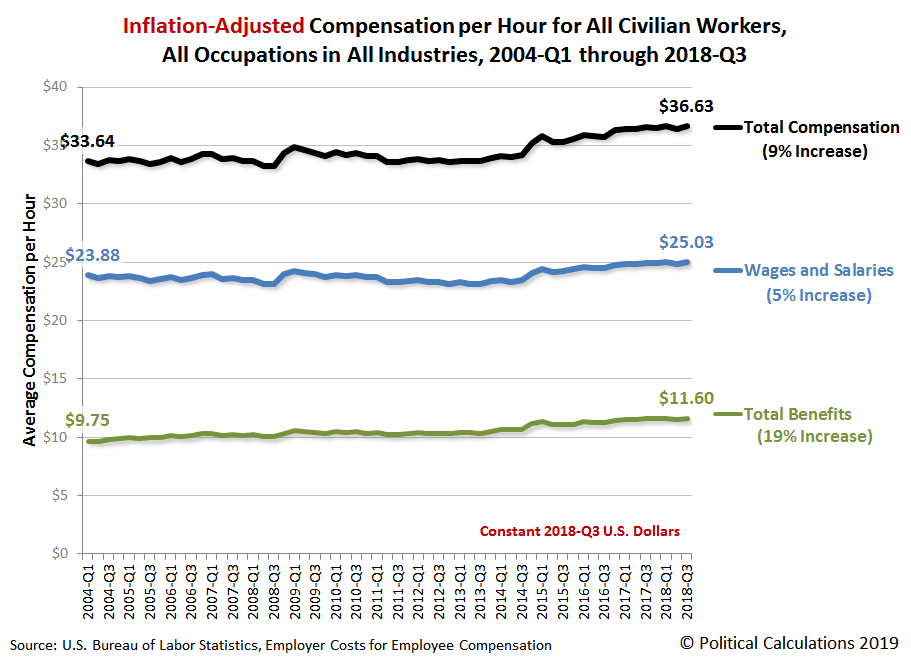
After taking inflation into account, we find that hourly wages and salaries have risen by 5% from 2004-Q1 to 2018-Q3 and that their benefits have increased by 19%. Together, the inflation-adjsuted total compensation of civilian employees in the U.S. has increased by 9% from 2004-Q1 through 2018-Q3.
Both employers and employees have incentives to favor benefits over wages and salaries in considering how employees will be compensated for their labor, where in particular, the portion of employee compensation that goes toward paying the employer-provided benefit of health insurance is exempt from federal, state and local income taxes.
Notes
[1] On a quarterly basis, following the North American Industry Classification System (NAICS) for tracking costs across various industries. The BLS also has annual employee compensation data going back to 1986 that followed the older Standard Industry Classification (SIC) code system.
References
U.S. Bureau of Labor Statistics. Employment Cost Trends: Employer Cost for Employee Compensation. [Online Database]. Accessed 4 January 2018.
Organization for Economic Co-operation and Development. Main Economic Indicators: Consumer Price Index: Total All Items for the United States (Quarterly, Seasonally Adjusted). [Online Database]. Accessed 4 January 2018.
Disclaimer: Materials that are published by Political Calculations can provide visitors with free information and insights regarding the incentives created by the laws and policies described. ...
more

