
AUD/USD Rate Approaches Yearly High Ahead Of RBA’s Last 2020 Meeting
AUD/USD breaks out of the range-bound price action carried over from the previous week as the US Dollar Index (DXY) seems poised to challenge the yearly low set on September 1 (91.75), and the correction from the yearly high (0.7414) appears to have been an exhaustion in the bullish trend rather than a change in behavior even though the RBA “is prepared to do more if necessary.”
Looking ahead, the RBA may move to the sidelines after laying out plans to purchase “$100 billion of government bonds of maturities of around 5 to 10 years over the next six months” as Australia unexpectedly adds 178.8K jobs in October, and it seems as though the central bank will keep the official cash rate (OCR) at the record low of 0.25% on December 1 as “the economic recovery is underway and positive GDP growth is now expected in the September quarter.”
In turn, Governor Philip Lowe and Co. may carry out a wait-and-see approach over the coming months as “the recovery is still expected to be bumpy and drawn out,” and key market trends may continue to influence AUD/USD in 2021 as the Federal Reserve’s balance sheet climbs to a fresh record high in November.
(Click on image to enlarge)
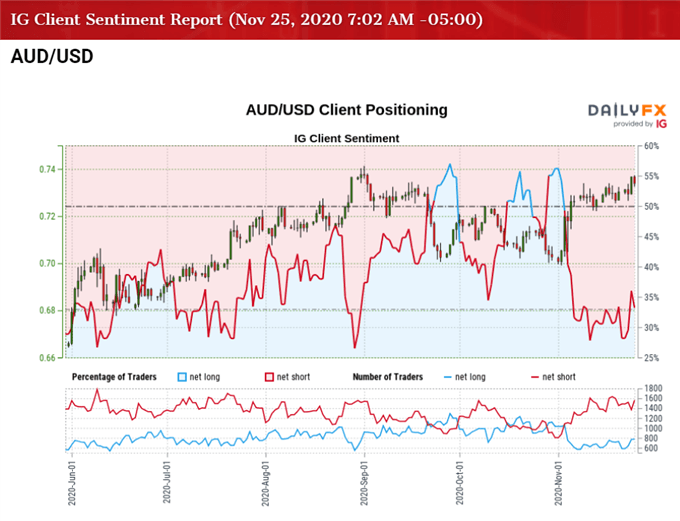
At the same time, the tilt in retail sentiment looks poised to persist as the crowding behavior from earlier this year reappears, with the IG Client Sentiment report showing 33.82% of traders are net-long AUD/USD as the ratio of traders short to long at stands 1.96 to 1.
The number of traders net-long is 10.70% higher than yesterday and 5.36% higher from last week, while the number of traders net-short is 1.52% higher than yesterday and 6.50% lower from last week. The rise in net-long position comes as AUD/USD breaks out of the range-bound price action carried over from the previous week, while the decline in net-short interest has helped to alleviate the tilt in retail sentiment as only 32.89% of traders were net-long the pair the week prior.
With that said, the correction from the yearly high (0.7414) appears to have been exhaustion in the bullish trend rather than a change in behavior as AUD/USD trades to a fresh monthly high (0.7374) ahead of the Thanksgiving holiday, and swings in risk appetite may continue to sway the exchange rate in December as the US Dollar largely exhibits an inverse relationship with investor confidence.
AUD/USD RATE DAILY CHART
(Click on image to enlarge)
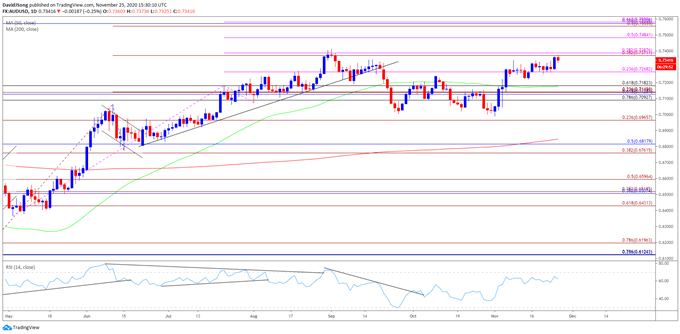
Source: Trading View
- Keep in mind, the advance from the 2020 low (0.5506) gathered pace as AUD/USD broke out of the April range, with the exchange rate clearing the January high (0.7016) in June as the Relative Strength Index (RSI) pushed into overbought territory.
- AUD/USD managed to clear the June high (0.7064) in July even though the RSI failed to retain the upward trend from earlier this year, with the exchange rate pushing to fresh yearly highs in August and September to trade at its highest level since 2018.
- The RSI instilled a bullish outlook for AUD/USD during the same period as it threatened the downward trend from earlier this year to push into overbought territory for the fourth time in 2020, but a textbook sell-signal emerged as the indicator quickly slipped back below 70.
- The RSI established a downward trend in September as the indicator fell to its lowest level since April, but the bearish momentum has abated as the RSI failed to push into oversold territory to reflect the extreme readings seen in March.
- As a result, it seems as though the correction from the yearly high (0.7414) was an exhaustion in the bullish trend rather than a change in behavior as AUD/USD cleared the October high (0.7243) earlier this month, with the move back above the 0.7270 (23.6% expansion) region bringing the Fibonacci overlap around 0.7370 (38.2% expansion) to 0.7390 (38.2% expansion) on the radar.
- AUD/USD appears to be on track to test the yearly high (0.7414) as it breaks out of the range bound price action carried over from the previous week and trades to a fresh monthly high (0.7374), but the RSI offers a mixed signal as the oscillator fails to reflect the extreme readings from earlier this year.
- The RSI struggles to push into overbought territory even though AUD/USD extends the rebound from the November low (0.6991), and the indicator may warn of a near-term correction in the exchange rate as long as it holds above 70.
- As a result, need a close above the Fibonacci overlap around 0.7370 (38.2% expansion) to 0.7390 (38.2% expansion) to open up the 0.7480 (50% expansion) area, with the next region of interest coming in around 0.7560 (50% expansion) to 0.7580 (61.8% expansion).
- However, AUD/USD may mimic the price action from September if it fails to close above the overlap around 0.7370 (38.2% expansion) to 0.7390 (38.2% expansion) again, with a move below the 0.7270 (23.6% expansion) region bringing the 0.7180 (61.8% retracement) area back on the radar.
Disclosure: See the full disclosure for DailyFX here.


