
AUD/USD Pullback Eyes 50-Day SMA As Bearish Price Series Emerges
AUD/USD falls back towards the 50-Day SMA (0.7708) after taking out of the March high (0.7849), and fresh data prints coming out of the US may continue to sway the exchange rate as Federal Reserve officials emphasize the new monetary policy framework.
While speaking at the National Association for Business Economics (NABE) International Symposium, Fed Vice-Chair Richard Clarida pointed out that “the Committee combined our forward guidance for the federal funds rate with enhanced, outcome-based guidance about our asset purchases,” but the permanent voting member on the Federal Open Market Committee (FOMC) went onto say that “the economy remains a long way from our goals” as the US Non-Farm Payrolls (NFP) report revealed a material slowdown in job growth.
Clarida struck a similar tone in regards to the spike in the Consumer Price Index (CPI) as inflation is “likely to rise somewhat further before moderating later this year,” and the comments suggest the FOMC is in no rush to switch gears as the central bank remains “committed to using our full range of tools to support the economy for as long as it takes.”
In turn, the FOMC may stick to the same script at the next interest rate decision on June 16 as the central bank braces for a transitory rise in inflation, but the recent flip in retail sentiment may continue to mimic the behavior seen in 2020 as the crowding behavior carried over from last year resurfaces.
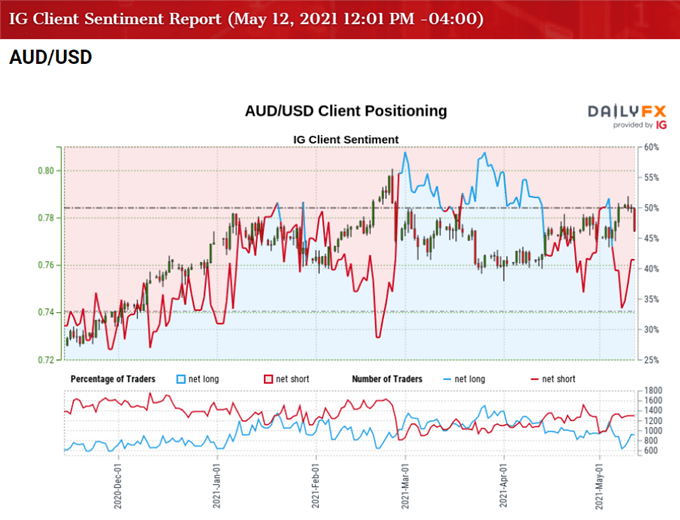
The IG Client Sentiment Report shows 44.09% of traders are currently net-long AUD/USD, with the ratio of traders short to long-standing at 1.27 to 1.
The number of traders net-long is 2.73% higher than yesterday and 14.74% lower from last week, while the number of traders net-short is 10.83% lower than yesterday and 11.52% lower from last week. The decline in net-long position comes as AUD/USD extends the decline from the monthly high (0.7891), while the drop in net-short interest has done little to alleviate the tilt in retail sentiment as 45.00% of traders were net-long the pair last week.
With that said, the decline from the February high (0.8007) may turn out to be a correction in the broader trend rather than a change in AUD/USD behavior as the crowding behavior from 2020 resurfaces, but the decline from the monthly high (0.7891) may push the exchange rate towards the 50-Day SMA (0.7708) as it carves a series of lower highs and lows.
AUD/USD RATE DAILY CHART
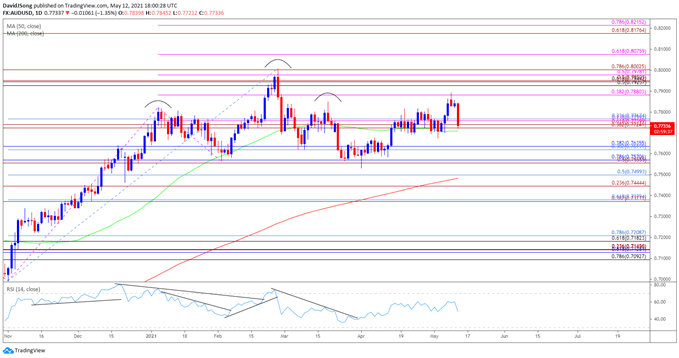
Source: Trading View
- A head-and-shoulders formation took shape as AUD/USD traded to a fresh yearly low (0.7532) in April, but the exchange rate appears to have negated the key reversal pattern following the failed attempt to close below the neckline around 0.7560 (50% expansion) to 0.7570 (78.6% retracement).
- The Relative Strength Index (RSI)showed a similar dynamic as the oscillator reversed course ahead of oversold territory to break out of the downward trend from earlier this year, and the decline from the February high (0.8007) may turn out to be a correction in the broader trend rather than a change in AUD/USD behavior as it takes out the March high (0.7849) in May.
- However, AUD/USD carves a series of lower highs and lows following the failed attempt to close above the 0.7880 (38.2% expansion) region, with a move below the 50-Day SMA (0.7708) bringing the 0.7620 (38.2% retracement) to 0.7640 (38.2% retracement) area on the radar.
Disclosure: See the full disclosure for DailyFX here.


