
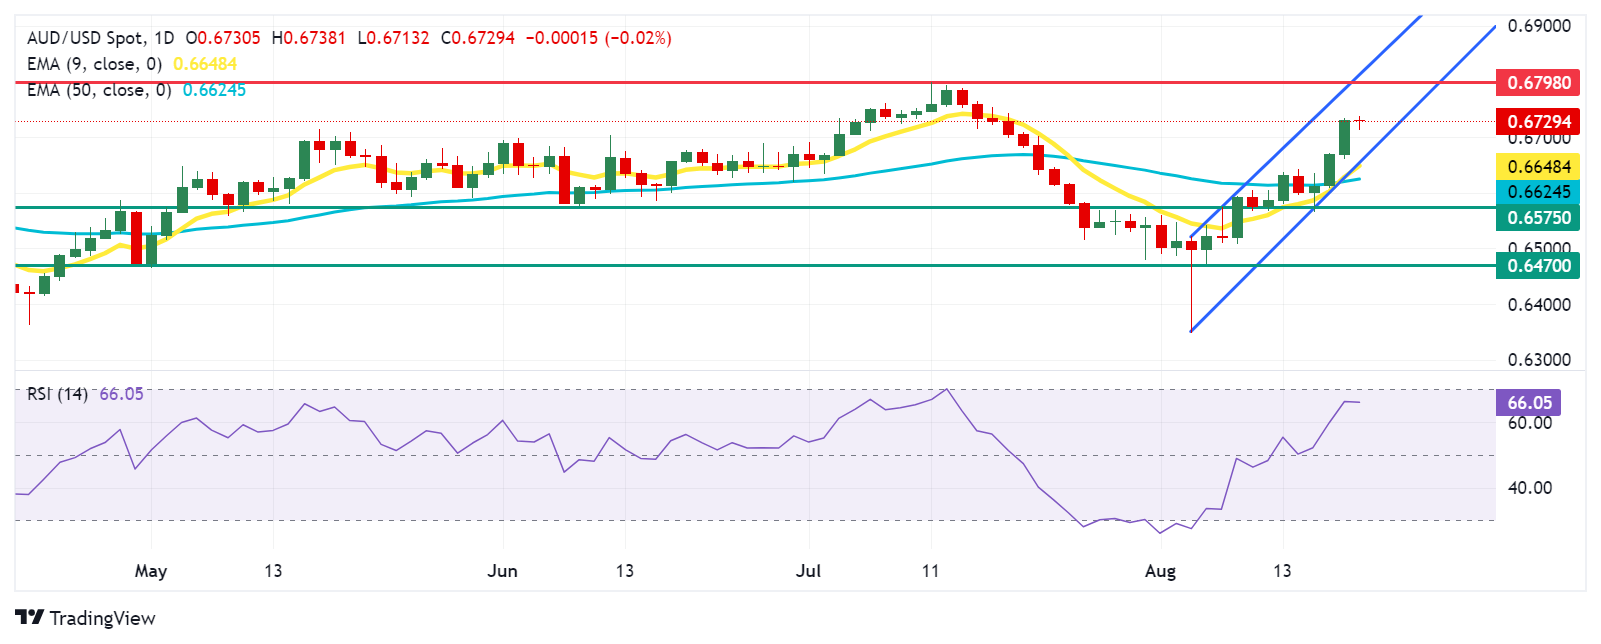
AUD/USD halts its three-day winning streak, trading around 0.6730 during the European hours on Tuesday. The daily chart analysis indicates that the pair is moving upward within an ascending channel pattern, which suggests the strengthening of a bullish bias.
Furthermore, the 14-day Relative Strength Index (RSI) is approaching the 70 mark, reinforcing the ongoing bullish momentum. Reaching the 70 level would signal an overbought condition for the currency pair, indicating a potential correction may be on the horizon.
Additionally, the daily chart analysis indicates that the 9-day Exponential Moving Average (EMA) has crossed above the 50-day EMA. This crossover suggests that price momentum is outpacing the longer-term trend, which signals a short-term bullish trend for the AUD/USD pair.
On the upside, the AUD/USD pair could approach the region around its seven-month high of 0.6798, which was reached on July 11. Further resistance appears around the upper boundary of the ascending channel at the 0.6820 level.
In terms of support, the AUD/USD pair may test the lower boundary of the ascending channel aligned with the nine-day EMA at 0.6648 level. Next support appears at the 50-day EMA at 0.6624 level.
A break below the 50-day EMA could weaken the bullish bias and exert downward pressure on the pair to test the throwback level at 0.6575. If the pair falls below this support level, it could drive it toward the next throwback level at 0.6470.
AUD/USD: Daily Chart
(Click on image to enlarge)
Australian Dollar PRICE Today
The table below shows the percentage change of Australian Dollar (AUD) against listed major currencies today. Australian Dollar was the weakest against the Swiss Franc.
| USD | EUR | GBP | JPY | CAD | AUD | NZD | CHF | |
|---|---|---|---|---|---|---|---|---|
| USD | 0.03% | -0.10% | -0.09% | -0.13% | 0.03% | -0.64% | -0.40% | |
| EUR | -0.03% | -0.14% | -0.15% | -0.14% | 0.02% | -0.37% | -0.43% | |
| GBP | 0.10% | 0.14% | 0.00% | 0.00% | 0.17% | -0.23% | -0.30% | |
| JPY | 0.09% | 0.15% | 0.00% | -0.02% | 0.13% | -0.25% | -0.32% | |
| CAD | 0.13% | 0.14% | -0.01% | 0.02% | 0.15% | -0.22% | -0.31% | |
| AUD | -0.03% | -0.02% | -0.17% | -0.13% | -0.15% | -0.38% | -0.47% | |
| NZD | 0.64% | 0.37% | 0.23% | 0.25% | 0.22% | 0.38% | -0.08% | |
| CHF | 0.40% | 0.43% | 0.30% | 0.32% | 0.31% | 0.47% | 0.08% |
The heat map shows percentage changes of major currencies against each other. The base currency is picked from the left column, while the quote currency is picked from the top row. For example, if you pick the Australian Dollar from the left column and move along the horizontal line to the US Dollar, the percentage change displayed in the box will represent AUD (base)/USD (quote).
More By This Author:
Silver Price Forecast: XAG/USD Pulls Back From $29.50 After Easing Of Middle-East TensionsAustralian Dollar Edges Lower Following RBA Minutes, PBoC Rate Decision
AUD/JPY Rises To Near 99.00 Following Hawkish Remarks From RBA Governor Bullock


Comments
Log in or sign up to join the conversation.