
AUD/USD Outlook: RSI Extends Downward Trend Following RBA Meeting
AUD/USD extends the decline from earlier this week as the RBA unveils plans to “purchase an additional $100 billion of bonds issued by the Australian Government and states and territories when the current bond purchase program is completed in mid-April.”
It seems as though the RBA will retain the current course for monetary policy even though “GDP is now expected to return to its end-2019 level by the middle of this year” as the central bank warns that “the economy is expected to operate with considerable spare capacity for some time to come.”
In turn, the RBA may utilize its balance sheet throughout 2021 as “the Board remains committed to maintaining highly supportive monetary conditions until its goals are achieved,” but it seems as though Governor Philip Lowe and Co. have little intentions of deploy more unconventional tools as “the recovery is expected to continue, with the central scenario being for GDP to grow by 3½ per cent over both 2021 and 2022.”
As a result, the pullback from the January high (0.7820) may turn out to be an exhaustion in the bullish trend rather than a change in AUD/USD behavior as key market themes remain in place, and it remains to be seen if the recent shift in retail position will highlight a similar dynamic as the crowding behavior from 2020 resurfaces.
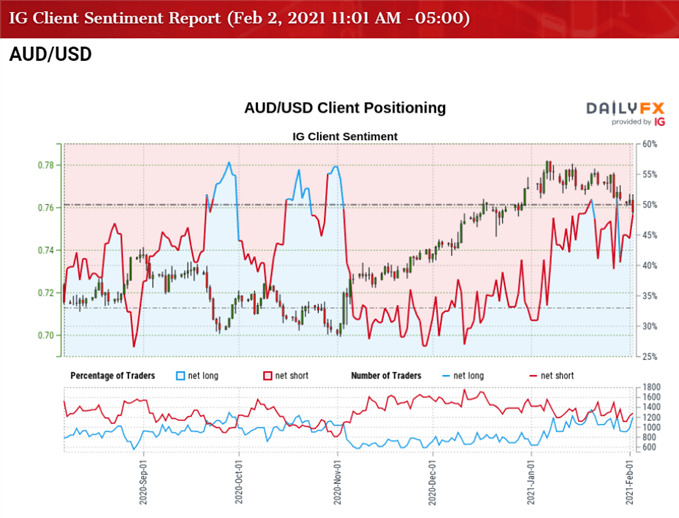
The IG Client Sentiment Report shows 49.41% of traders are currently net-long AUD/USD, with the ratio of traders short to long-standing at 1.02 to 1. The number of traders net-long is 2.80% higher than yesterday and 11.57% higher from last week, while the number of traders net-short is 7.24% lower than yesterday and 14.06% lower from last week.
The decline in net-short position could be a function of profit-taking behavior as AUD/USD trades to a fresh yearly low (0.7564), but the rise in net-long position has failed to prevent a flip in retail sentiment as 51.20% of traders were net-long the pair during the previous week.
With that said, the shift in retail sentiment may continue to accompany the decline in AUD/USD as the exchange rate trades below the 50-Day SMA (0.7589) for the first time since November, with the Relative Strength Index (RSI) still highlighting the scope for a further decline in the exchange rate as the indicator extends the downward trend established earlier this year.
AUD/USD RATE DAILY CHART
(Click on image to enlarge)
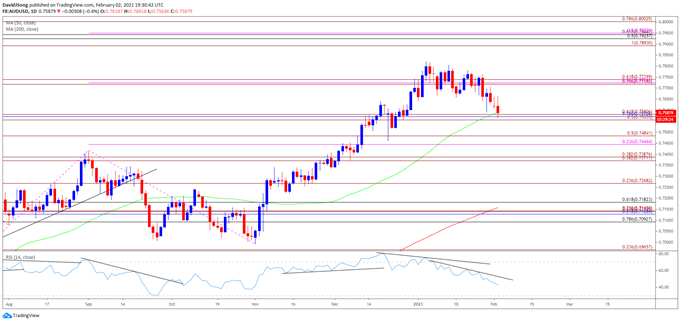
Source: Trading View
- Keep in mind, the AUD/USD correction from the September high (0.7414) proved to be an exhaustion in the bullish trend rather than a change in behavior as the exchange rate traded to fresh yearly highs throughout December.
- At the same time, developments in the Relative Strength Index (RSI)showed the bullish momentum gathering pace as the indicator pushed into overbought territory for the first time since September, with the break above 70 accompanied by a further appreciation in AUD/USD like the behavior seen in the first half of 2020.
- However, a textbook RSI sell signal emerged following the failed attempt to test the March 2018 high (0.7916), with the oscillator still tracking the downward trend established earlier this year.
- Failure to preserve the opening range for January has pushed AUD/USD to fresh 2021 lows, with a break/close below the Fibonacci overlap around 0.7560 (50% expansion) to 0.7580 (61.8% expansion) bringing the 0.7440 (23.6% expansion) to 0.7480 (50% expansion) region on the radar.
- Next area of interest comes in around 0.7370 (38.2% expansion) to 0.7390 (38.2% expansion) followed by the 0.7270 (23.6% expansion) region.
Disclosure: See the full disclosure for DailyFX here.


