
AUD/USD Carves Bearish Series, RSI Threatens Upward Trend
AUD/USD fills the gap from earlier this week as updates to Australia’s Gross Domestic Product (GDP) report instills a weakened outlook for the region, and recent price action raises the risk for a further depreciation as the exchange rate carves a series of lower highs & lows.
AUD/USD CARVES BEARISH SERIES, RSI THREATENS UPWARD TREND

Signs of a slower growth is likely to keep the Reserve Bank of Australia (RBA) on the sidelines at the first 2019 meeting on February 4 as ‘the low level of interest rates is continuing to support the Australian economy’, and the central bank may continue to endorse a wait-and-see approach over the coming months as ‘growth in household income remains low, debt levels are high and some asset prices have declined.’
Even though the U.S. and China agree on a 90-day truce, the ongoing shift in trade policy may continue to dampen the economic outlook for the Asia/Pacific region the RBA sees ‘signs of a slowdown in global trade.’ In turn, Governor Philip Lowe & Co. appears to be on track to support the real economy throughout 2019, and it seems as though the central bank is also bracing for a further depreciation in the aussie-dollar exchange rate as ‘there has also been a broad-based appreciation of the US dollar this year’.
In turn, AUD/USD may continue to chip away at the advance from the 2018-low (0.7021) as the Federal Reserve is widely expected to deliver a 25bp rate-hike next month, but the recent pickup in volatility appears to be spurring a round of profit-taking amid the drop in retail interest.
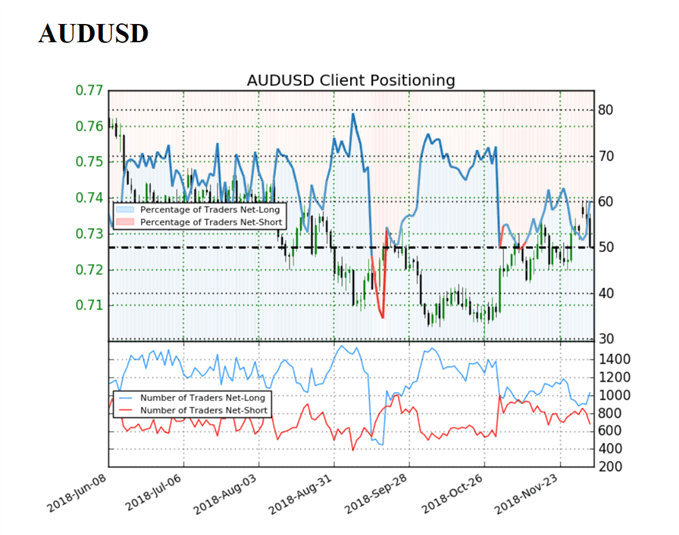
The IG Client Sentiment Report shows 60.3% of traders are now net-long AUD/USD compared to 54.3% last week, with the ratio of traders long to short at 1.52 to 1. However, the number of traders net-long is 23.5% higher than yesterday and 5.4% lower from last week, while the number of traders net-short is 31.5% lower than yesterday and 17.0% lower from last week.
Waning participation may foster range-bound conditions as market participants eagerly wait for the Federal Open Market Committee (FOMC) interest rate decision on December 19, but the growing skew in retail position offers a contrarian view to crowd sentiment especially as both price and the Relative Strength Index (RSI) start to threaten the bullish formations carried over from October.
AUD/USD DAILY CHART
(Click on image to enlarge)
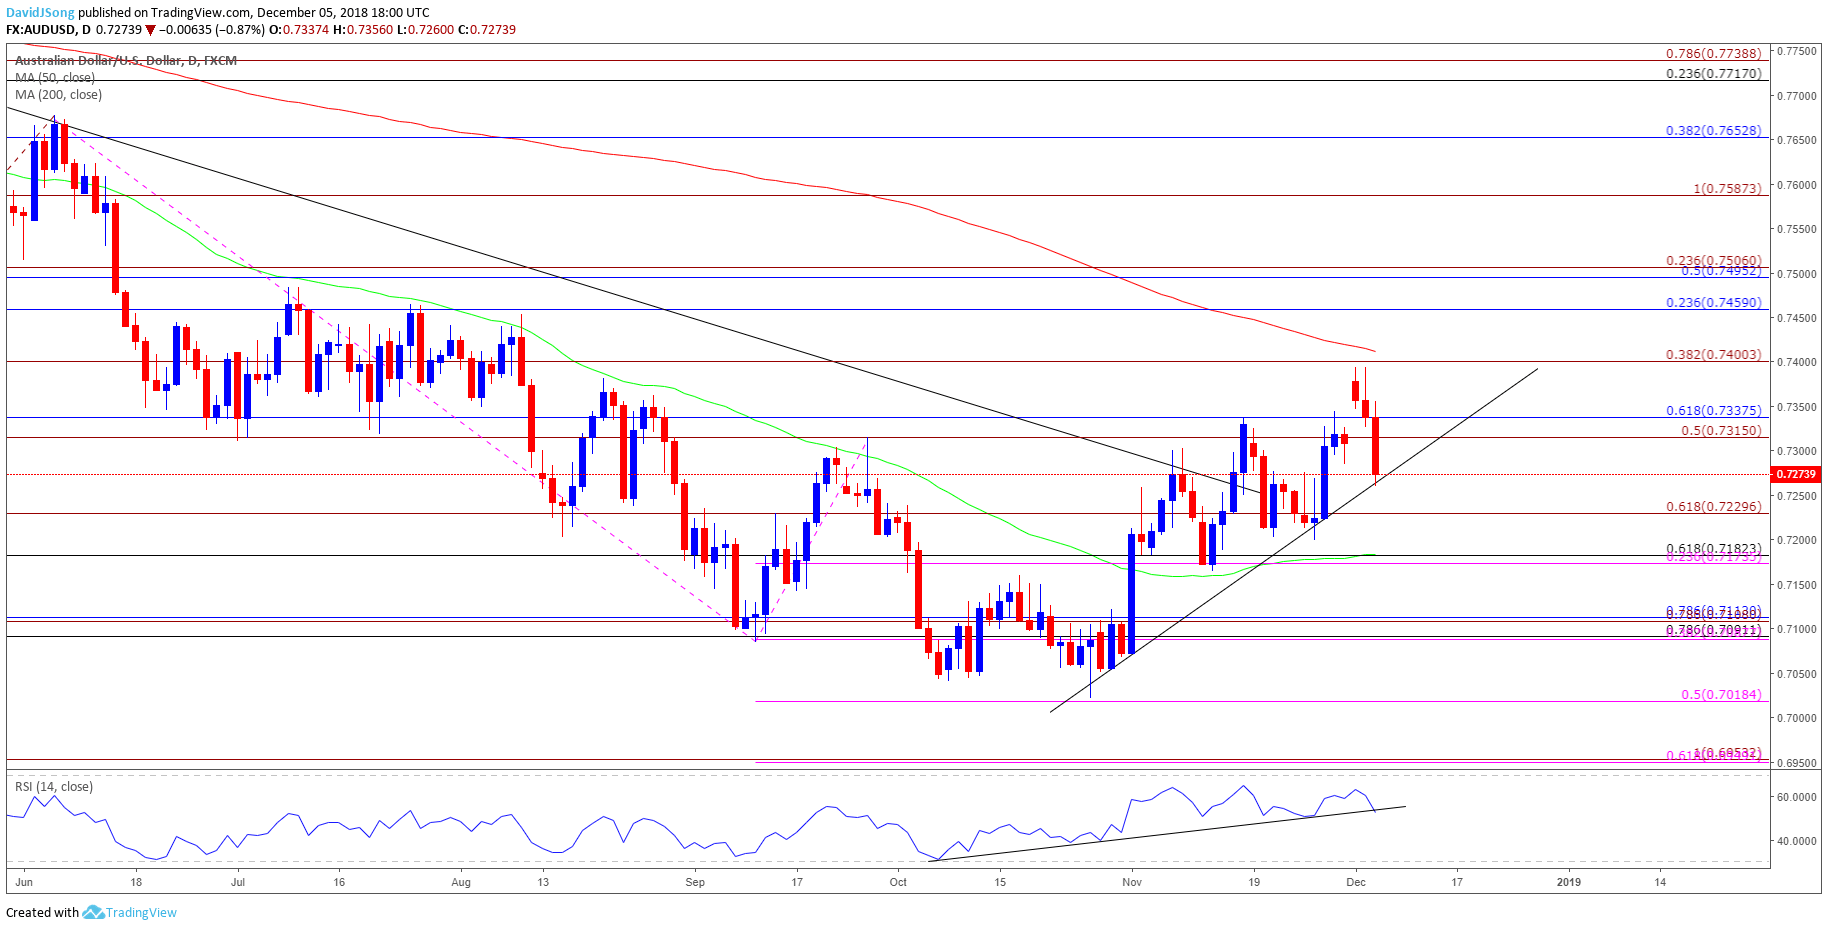
- Keep in mind, the break of the September-high (0.7315) instills a constructive outlook for AUD/USD, but the advance from the 2018-low (0.7021) appears to be sputtering ahead of the 0.7400 (38.2% expansion) handle as both price and the Relative Strength Index (RSI) threaten the upward trends carried over from October.
- With that said, lack of momentum to hold above the 0.7320 (50% expansion) to 0.7340 (61.8% retracement) region brings 0.7230 (61.8% retracement) on the radar, with the next downside region of interest coming in around 0.7170 (23.6% expansion) to 0.7180 (61.8% retracement).
- Next downside hurdle comes in around 0.7090 (78.6% retracement) to 0.7110 (78.6% retracement) followed by 0.7020 (50% expansion), which lines up with the 2018-low (0.7021).
(Click on image to enlarge)
Disclosure: Do you want to see how retail traders are currently trading the US Dollar? Check out our IG Client Sentiment ...
more

