

Image Source: Unsplash
AUD/USD is paddling in circles just below 0.6550 as the pair pulls into the center ahead of Tuesday’s showing from the Reserve Bank of Australia (RBA). Wednesday sees the Federal Reserve’s (Fed) latest Meeting Minutes from the Federal Open Market Committee (FOMC), and early Thursday sees Australia’s latest Purchasing Manager’s Index (PMI) figures for February.
The RBA is expected to hold steady on Tuesday and keep rates pinned where they are. Aussie labor figures disappointed markets recently, but it will likely take several months of soft employment numbers before the RBA gets pushed into a rate-cut cycle.
The FOMC’s latest Meeting Minutes, due Wednesday, are going to draw plenty of investor attention as markets try to suss out when the US central bank will begin trimming interest rates. US inflation and a still-tight US labor market continue to flummox rate cut hopes from broader markets. Money markets are currently pricing in a first rate cut from the Fed in June, with the CME’s FedWatch Tool forecasting a 75% chance of at least 25 basis points in rate cuts in June, with at least a further 25 basis points expected in July.
The back half of the trading sees Australian Judo Bank PMI numbers for February, and the Composite Aussie PMI has only printed above 50.0 for four of the last twelve successive prints. Australia’s Judo Bank Services PMI last came in at 49.1, while the Manufacturing component last printed at 50.1.
AUD/USD technical outlook
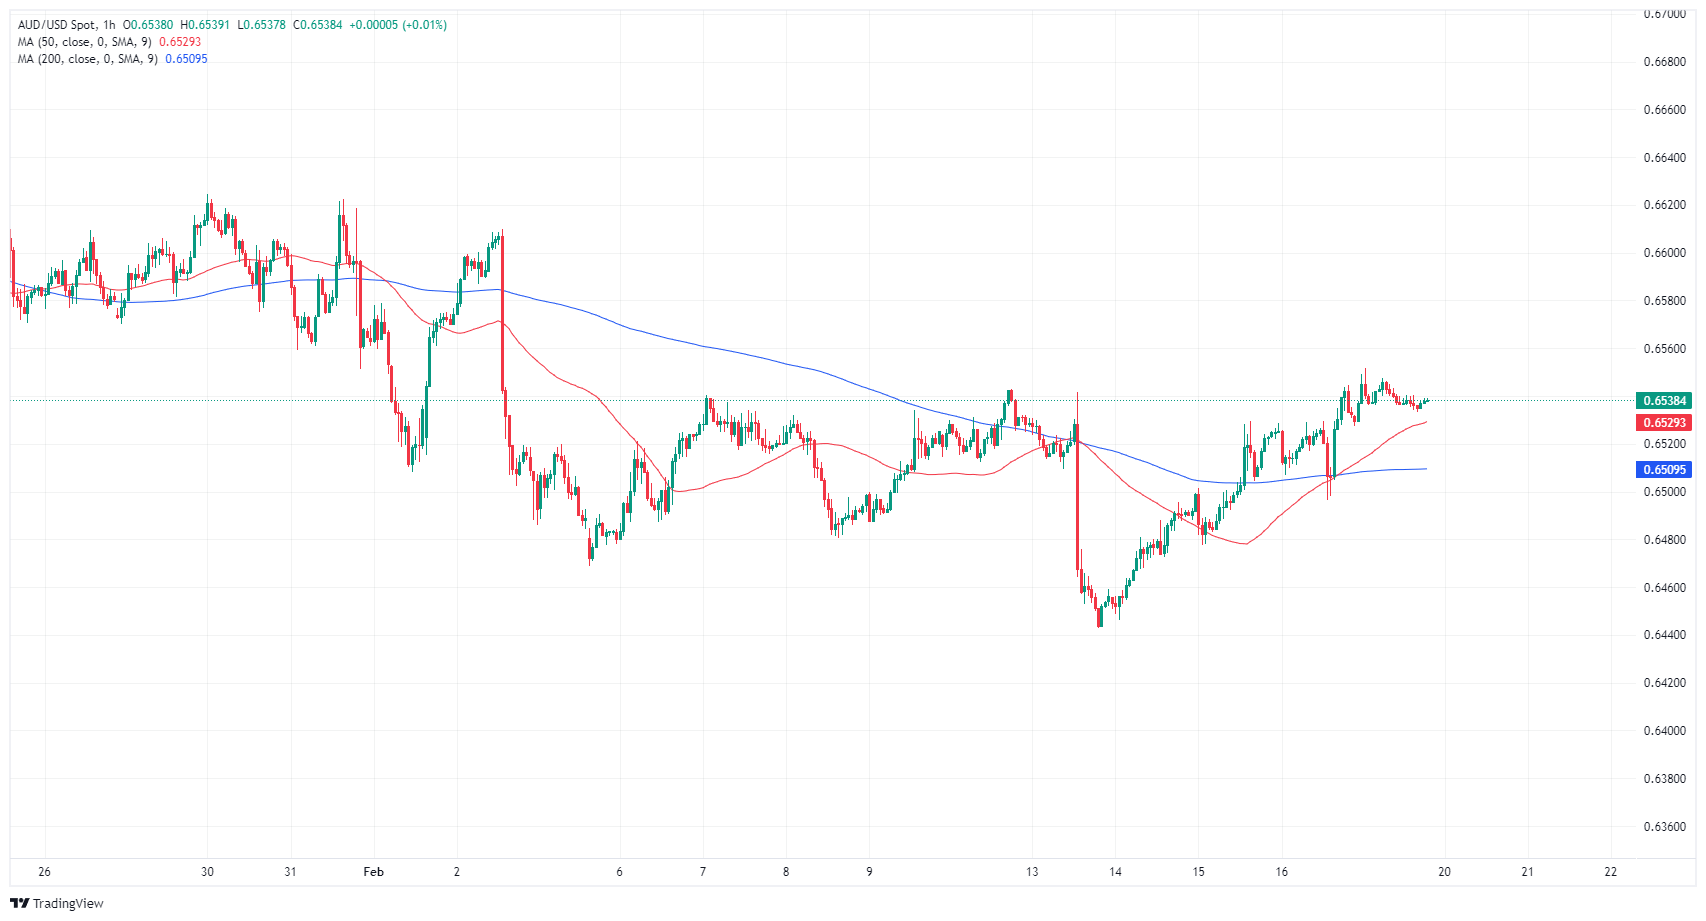
AUD/USD bounced off the 200-hour Simple Moving Average (SMA) near 0.6510 late last week, leaving the pair positioned in the high end near-term, and the pair is poised for a fresh bullish run at the 0.6600 handle with the Aussie extending a recent bullish reversal. The pair is finding some technical resistance at recent swing highs into 0.6540.
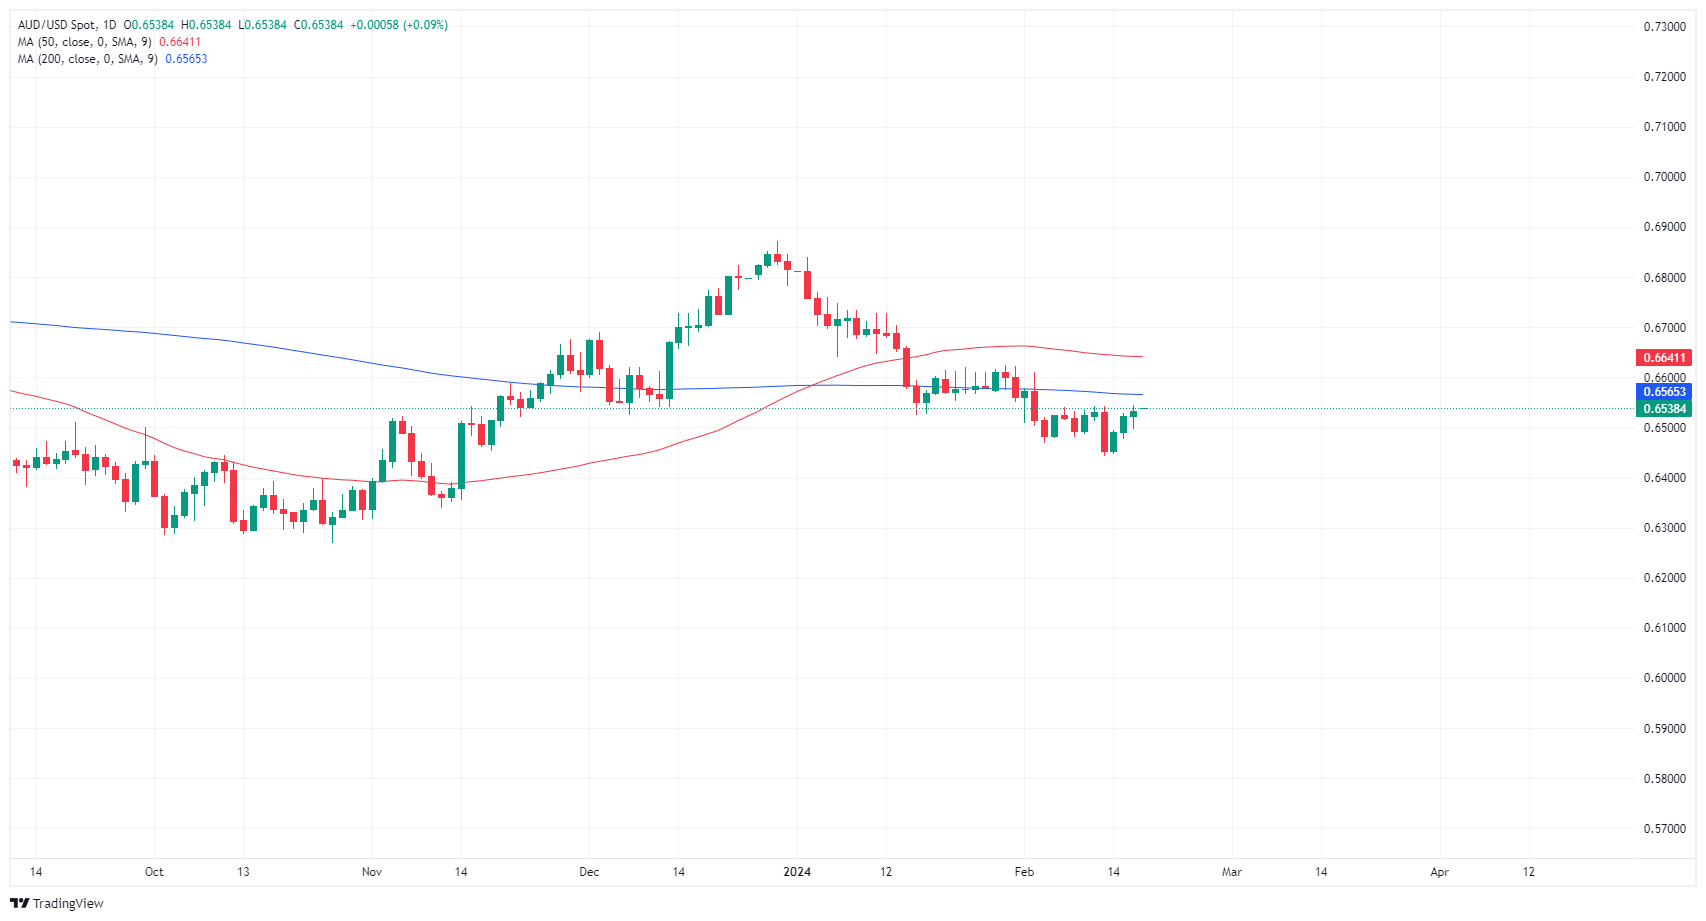
The AUD/USD is looking for a foothold from a recent bottom near 0.6450 after the pair declined from December’s peak near 0.6870, and the pair is still down nearly 5% as January market flows struggle to stem the bearish tide.
AUD/USD hourly chart
(Click on image to enlarge)
AUD/USD daily chart
(Click on image to enlarge)
AUD/USD
| OVERVIEW | |
|---|---|
| Today last price | 0.6539 |
| Today Daily Change | 0.0006 |
| Today Daily Change % | 0.09 |
| Today daily open | 0.6533 |
| TRENDS | |
|---|---|
| Daily SMA20 | 0.6541 |
| Daily SMA50 | 0.6642 |
| Daily SMA100 | 0.6544 |
| Daily SMA200 | 0.6566 |
| LEVELS | |
|---|---|
| Previous Daily High | 0.6545 |
| Previous Daily Low | 0.6496 |
| Previous Weekly High | 0.6545 |
| Previous Weekly Low | 0.6443 |
| Previous Monthly High | 0.6839 |
| Previous Monthly Low | 0.6525 |
| Daily Fibonacci 38.2% | 0.6526 |
| Daily Fibonacci 61.8% | 0.6515 |
| Daily Pivot Point S1 | 0.6504 |
| Daily Pivot Point S2 | 0.6476 |
| Daily Pivot Point S3 | 0.6456 |
| Daily Pivot Point R1 | 0.6553 |
| Daily Pivot Point R2 | 0.6573 |
| Daily Pivot Point R3 | 0.6601 |
More By This Author:
U.S. Dollar Trades Neutral While The U.S. Commemorates Presidents’ Day
EUR/USD Dips Amid US Holiday Trading, German Recession Woes
AUD/JPY Retraces Its Gains On Improved Japan Machinery Orders, Trades Around 98.10


Comments
Log in or sign up to join the conversation.