
As Geopolitical Tension Rise, Q1 2019 Earnings Estimates Fall: S&P 500 Approaches 200-DMA
It was a headline-heavy week that drove the S&P 500 (SPX ) absolutely... nowhere. In fact, after a strong start to the trading week, and a subsequent pullback in the middle of the week, by week’s end the S&P 500 was up a scant .005% for the week. We can look toward the abundance of headlines on trade and slowing global economic activity as the culprit for the market’s pause this week, but more than likely this will prove a more technical pause than fundamental pause.
Given the strength of the rally off of the Christmas Eve 2018 lows, the S&P 500 and most every index ETF recently found itself in overbought territory. With the market pausing its advance last week, many of the index ETFs are back to neutral territory while the rest remain overbought.
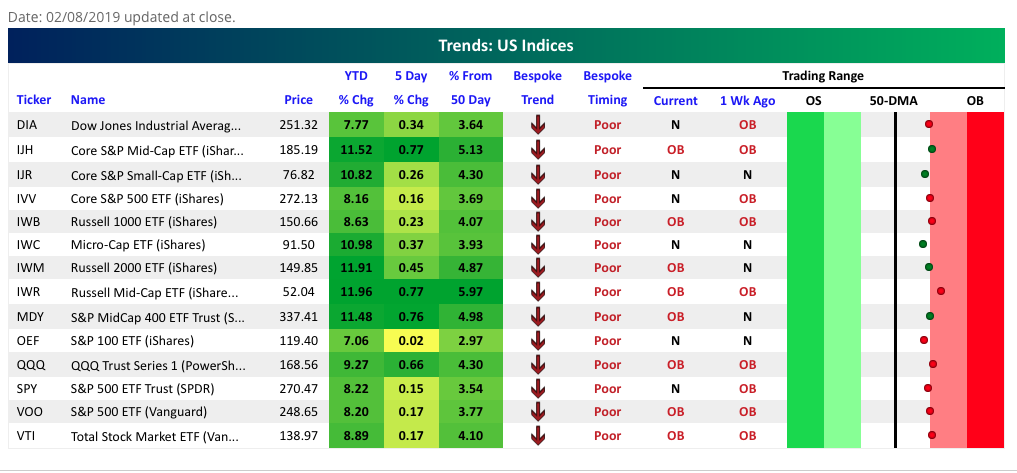
As shown in the table above from Bespoke Investment Group, the Dow Jones Industrial Average (DJIA) and S&P 500 Spiders ETF (SPY) are back in neutral territory when compared to their overbought status from a week ago. While in neutral territory they are basically teetering between the two conditional states of being overbought or neutral.
I have discussed, in many recent narratives, the technical levels that serve as support and/or resistance for the S&P 500. During this uptrend, the benchmark index has moved above and beyond its 50-DMA. Beyond that level is the next big hurdle, which continues to be the 200-DMA, residing at roughly 2,742.
In the week that was, the S&P 500 attempted to rally up to this technical level and narrowly missed achieving it before falling back down to the 100-DMA. The failure to get the S&P 500 above the 200-DMA on the first attempt is not the end of the world, but it doesn’t help short-term sentiment, given the backdrop of somewhat negative global economic growth headlines.
At present, the S&P 500 is right around its 100-DMA, another key level of what is now support. From a technical perspective, what I’ve discussed in recent weeks is that a potential for a market pullback is highly probable until we hold above the 100-DMA and break solidly through the 200-DMA. Until BOTH technical milestones are achieved, the risk of a pullback is still at heightened levels.
So what is driving the market? My acronym for markets in 2019 is plainly and simply Earnings-FOMC-Global Trade or EFG . These 3 factors will likely feed into each other and be portrayed with either strength or weakness in the S&P 500 throughout the year. Obviously, in order for the market to trend higher, the market demands resolution on global trade (China/U.S./EU), a maintaining of a dovish Fed and earnings growth to tic higher throughout the calendar year. Without these 3 components coming to fruition, it is unlikely that the current S&P 500 will be sustained. With that said and with the S&P having paused in the week that was, let’s take a look at what’s on-tap for the coming week.
S&P 500 Pause That Refreshes?
Two weeks ago, the S&P 500 weekly expected move was $47/points. Last week that weekly expected move fell to $40/points and this week, well it really hasn’t budged that much.

As shown in the table above from TD-Ameritrade’s Think or Swim platform, the weekly expected move for the coming week is roughly $41/points. It should be noted that in each of the prior 2 weeks, the S&P 500 managed to stay within the weekly expected move. As the market has climbed higher, market efficiency has also been found to increase, with volatility on the decline. The VIX dropped under 16 this past week, before popping higher on the sell-off that started Wednesday.
Friday proved to be a very volatile market day with the S&P 500 falling greater than 1% intraday and before rallying into the close and to finish ever so slightly higher on the trading day. What I believe we witnessed on Friday was the so-called FOMO rally (Fear Of Missing Out). Essentially, the market had fallen on Wednesday and Thursday for two main reasons, headlines outside of the United States centered on declining economic growth from within the European Union and trade headlines suggesting the U.S. and China may not reach a deal by March 2, 2019. Regardless of these two concerns, the market sentiment didn’t seem to point toward greater declines and with technical levels still proving supportive, investors bought the dip just in case something positive surfaces in the near future as it relates to trade. Subsequently, FOMO ensued and the VIX eased lower, back below 16.
Before getting into some of the fundamental market drivers let’s take a look at one more chart related to the S&P 500 and its failing to achieve a break above the 200-DMA this past week. The stall in the index last week started from the backtest of the 200-DMA (red line).
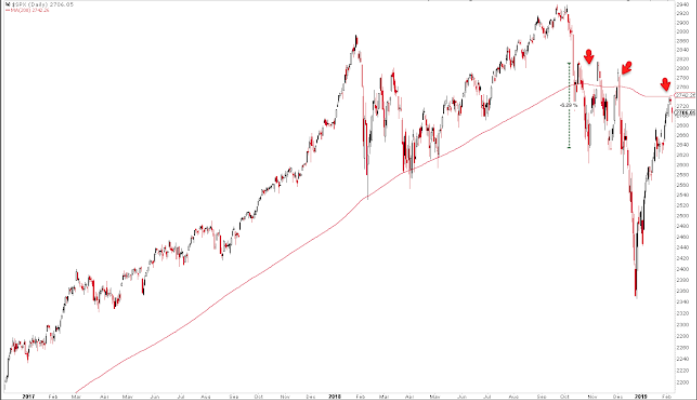
This was actually the 4th time SPX has tried to regain the 200-DMA since early October (arrows). Importantly, the slope of the 200-DMA is flat; a condition that is unlike those during bear markets. This is typically explained as when the index is best able to break higher. In other words, the S&P 500 usually succeeds in breaking above its 200-DMA after several failed attempts and when the 200-DMA is flat. It goes without saying, however, that the USUAL did not pan out to well for markets in 2018.
S&P Fundamental Drivers
If you haven’t heard by now, the market has a history that suggests it is very much correlated to the trajectory of corporate earnings over time. While it’s true that macro-factors can impede this correlation from time-to-time, longer-term it’s safe to say that as earnings go, the market follows. So let’s look at the earnings picture as we muddle through the Q4 2018 earnings season that also offers a look at Q1 2019 earnings projections.
- To date, 66% of the companies in the S&P 500 have reported actual results for Q4 2018.
- In terms of earnings, the percentage of companies reporting actual EPS above estimates (71%) is equal to the five-year average.
- In aggregate, companies are reporting earnings that are 4.0% above the estimates, which is below the five-year average.
- In terms of revenues, the percentage of companies reporting actual revenues above estimates (62%) is above the five-year average.
- The blended year-over-year earnings growth rate for the fourth quarter is 13.3% today, which is above the earnings growth rate of 12.0% last week.
By the time Q4 2018 earnings season is done and over with, Thomson Reuters anticipates earnings to have grown 16.8% year-over-year. While 2018 proved to be an extremely strong year for earnings growth, those comparisons are now proving to be an extreme headwind for earnings growth in 2019. Given the markets already substantial 16% rally off of the December 2018 lows, the forward four-quarter (19Q1 – 19Q4) P/E ratio for the S&P 500 is 16.0 and possibly proving a concern for investors who are struggling to find favor or confidence in FY19 earnings growth.
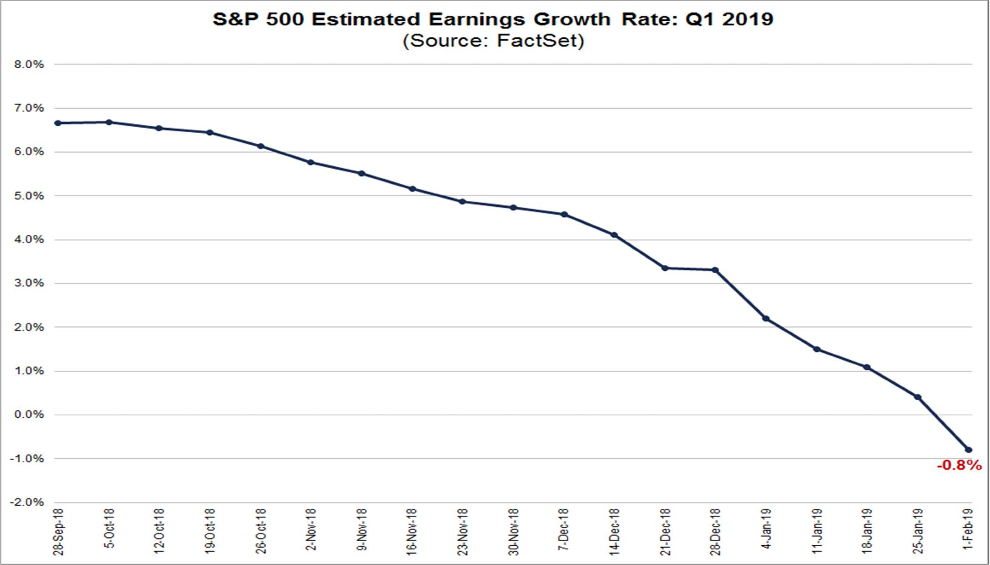
As shown in the chart of earnings above (from 2 weeks ago), Wall Street analysts had slashed earnings expectations for the first quarter of 2019 so sharply that the overall estimate of profit growth for the period has turned negative. FactSet’s most recent forecast has fallen even further after this past week’s earnings and forecasts from the S&P 500 earnings season. Earnings are now expected to fall on average by 1.7% in Q1 2019.
The slide in expectations matches the view of Morgan Stanley chief equity strategist Mike Wilson.
"Earnings are deteriorating even faster than we expected," Wilson said in a note this past week. "The earnings revision breadth over the past month has been even more negative than we expected leading us to think [the] earnings recession trough in the U.S. could be later than 1Q and deeper."
S&P 500 corporate forecasts have shined a light on the future and suggest that companies are guiding conservatively given the uncertainty surrounding global trade and a multitude of factors underlying the U.S. Dollar strength. Given such guidance for 2019 and the quarter underway, analysts’ sentiment hasn’t risen all that much.
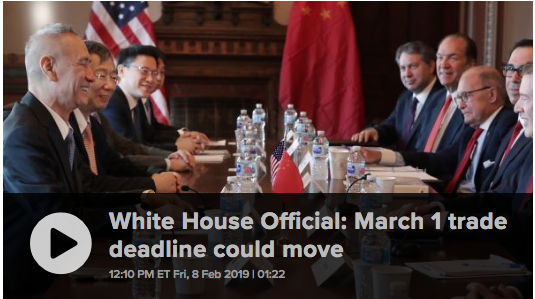
Next week will be another trade-headline week, we expect. U.S. negotiators will head to China and while there are few signs any kind of deal is near, many strategists expect to see some signs that talks will continue and an eventual agreement will be reached, even if a March 1 deadline on new tariffs is pushed back.
We’re still yet another week away from another trade issue popping up for investors though. The Commerce Department, by Feb. 17, is expected to release a broad report on auto imports and national security, and experts say a part of that report could recommend tariffs on European autos. The White House would then have 90 days to respond. Given the issues surrounding European economic growth already playing a role in the European equity markets faltering last week, the delivered report from the U.S. Commerce Department could further pressure the region’s equity markets.
If we combine the notion that a U.S./China trade deal is potentially being pushed back with the threat of EU auto tariffs, investors are facing more uncertainty, not less. Given how far the markets have come thus far, this only serves as another potential reason for the market to pause and/or pullback as it awaits clarity on global trade and while more economic data comes into focus now that the U.S. government is able to release data. Recall that much of December’s economic data had been withheld due to the government shutdown. So let’s look at some of the economic data that is slated for the week ahead.
Economic Data, Finally
With the longest government shutdown in history came a lapse in economic data being reported. Some of the most important data related to the consumer, housing, and inflation has been speculated upon, but will finally be known.
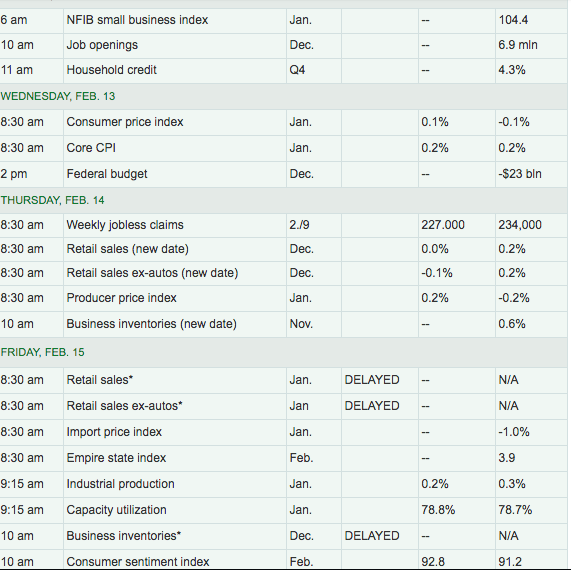
While no major economic data release is slated for Monday, Tuesday will bring with it the NFIB Index and JOLTS Survey. Later in the week we’ll get to see what retail sales were like in December but not before a key look at inflation gauges.
Fortunately, our economy finds it incredibly difficult to build inflation pressure. What brings about certain inflation, Amazon and a host of other corporations taketh away, as they say. As shown through the Consumer Price Index (CPI) data, the rate of consumer inflation in the 12 months ended in December slipped to 1.9% from a seven-year high of 2.9% at the beginning of last summer. It could fall below 1.5% in January.
The chief source of falling inflation is lower oil prices, but medical costs have also risen at their slowest past over the past 2 years. The global economy, meanwhile, has taken a turn for the worse and triggered declines in the prices of many key commodities such as metals and grains. That’s also holding inflation back.
What was most disappointing, as it relates to inflation in 2018, is that while it didn’t appear, the Fed still hiked rates as recently as December. The Fed clearly learned a lesson, a lesson delivered by the market, after that last rate hike. The Fed doesn’t think inflation is a big worry going forward. Chairman Jerome Powell said as much after the central bank adopted its newest dovish stance whereby patience is the forecast for 2019 rate hikes.
“Inflation readings have been muted, and the recent drop in oil prices is likely to push headline inflation even lower still in coming months,” Powell said.
Fund Flows
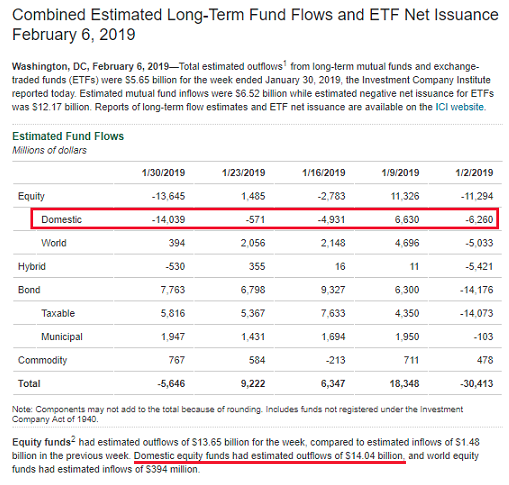
In spite of the strong returns so far this year, investor fund flows into mutual funds and exchange-traded funds have been decidedly negative. A recent fund flow report by the Investment Company Institute (ICI) reported, "domestic” equity funds had estimated outflows of $14.04 billion." As the below table shows, four of the last five weeks have seen domestic equity outflows.
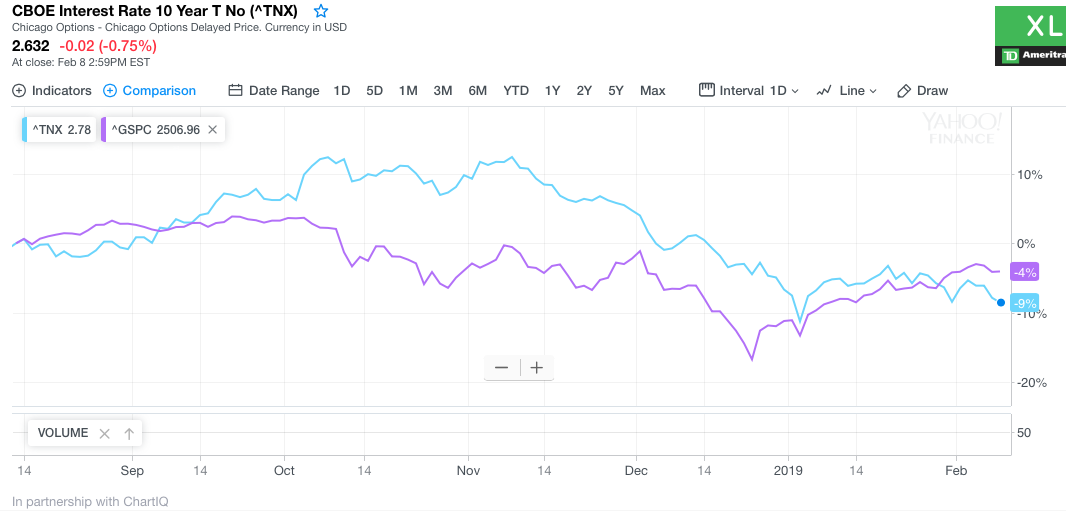
One of the abnormalities of the equity market rally in the New Year is that it hasn’t come at the expense of the bond market. During a “risk on” environment, where investors view stocks favorably, they tend to show less interest in bonds, which tends to result in rates/yields rising. As the below chart shows though, in spite of higher equity prices, the 10-year treasury bond yield has remained fairly stable. A stronger economy should boost bond yields as well as stocks, and encourage some bond selling. So far, that hasn't happened. Bond yields have rallied very little and recently taken another turn lower.
Getting back to our fund flow discussion, according to Lipper FundFlows reporting, for the second week in a row equity ETFs witnessed net outflows and handed back a little less than $437 million for the most recent fund-flows week.
- Authorized participants (APs) were net redeemers of domestic equity ETFs (-$2.8 billion) for the fourth consecutive week.
- Nondomestic equity ETFs witnessed net inflows for the third week running, attracting $2.4 billion this past week.
- iShares MSCI Emerging Markets ETF (EEM, +$1.4 billion) and iShares Core MSCI Emerging Markets ETF (IEMG, +$859 million) attracted the largest amounts of net new money of all individual equity ETFs.
- SPDR S&P Dividend ETF (SDY, -$1.2 billion) experienced the largest individual net redemptions and SPDR S&P 500 ETF (SPY, -$1.0 billion) suffered the second largest net redemptions of the week.
The bottom line is that while the equity markets have rallied in the New Year, analyst sentiment has risen very little and fund flows have been negative. How much longer do you think this can last and when we further consider the S&P 500 is a teetering back-and-forth between overbought and neutral territory and after failing to achieve its 200-DMA in the most recent week?
Final Thoughts
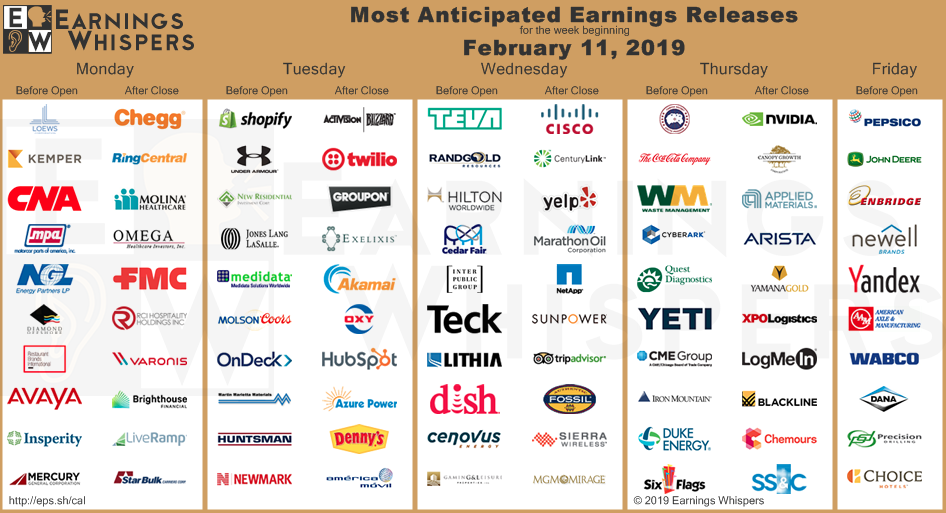
Economic data will be heavy this week, but so will headlines surrounding trade, Brexit and… well, the macro-headlines will be in abundance and none are likely to suggest a near-term resolution. That’s a problem for the equity market in my view and given the current forward 12-month PE of 16 and when juxtaposed with Q1 2019 EPS estimates continually being lowered. Having said all of that and with the market being "overbought", markets can stay overbought for longer than people think. The same can be said about oversold conditions. The more important earnings due out this week are shown in the graphic below from Earnings Whispers.
The market held firm to its lowest VIX levels of the year through much of the week that was, even with a bout of volatility to end the trading week. When we look at 30-day Realized volatility/Historical volatility, it has also come way, way down in the New Year and hovers just a few percent above implied volatility/VIX .
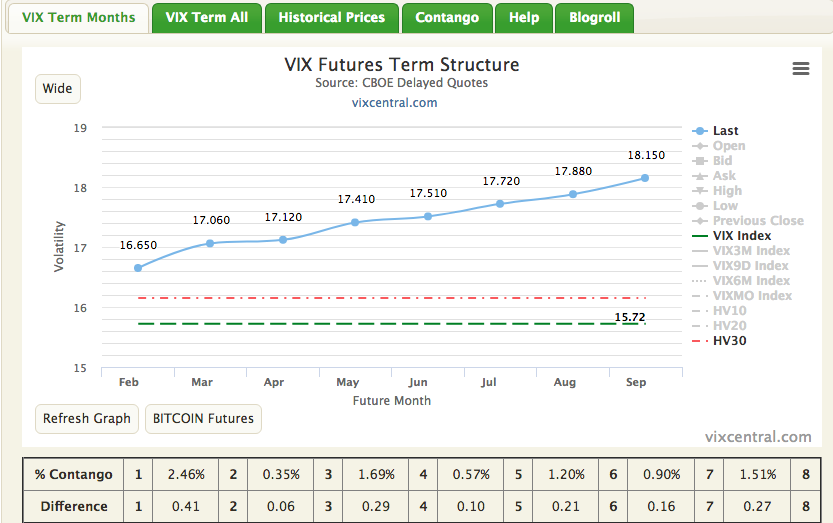
Having said that and as shown in the VIX Futures Term Structure chart above, VIX Futures are relatively flat, with front-month Futures contracts only slightly lower/less than that of back month contracts. This leads us to believe that most traders are not anticipating much lower volatility than that which has been expressed year-to-date. Keep in mind that the coming week will be an expiration week whereby the front month VIX futures contract will expire and back month futures contracts will roll forward (M1 expires, M2 rolls forward and so forth). Most VIX-ETPs are now found with a majority of assets under management (AUM) based on M2 holdings.
As it pertains to investor sentiment, the market rally has bred more bullish investor sentiment of late. Optimism about the short-term direction of stock prices jumped to a three-month high in the latest AAII Sentiment Survey. Neutral sentiment also rose, while pessimism plunged.
Bullish sentiment, expectations that stock prices will rise over the next six months, rose 8.1 percentage points to 39.9%. Optimism was last higher on November 7, 2018 (41.3%). This is just the fourth time in five months that bullish sentiment is at or above its historical average of 38.5 percent. Pessimism was last lower on June 13, 2018 (21.7%). This is just the third time bearish sentiment is below its historical average of 30.5% during the past five months.
This week’s special question asked AAII members for their thoughts on the prospect of the Federal Reserve pausing its cycle of raising interest rates. Nearly two-thirds of the respondents (65%) agree with the neutral stance. Many of these respondents pointed to the lack of inflationary pressures, approve of chairman Jerome Powell’s talk of being data dependent or noted current uncertainties over trade. While we understand that the Fed has essentially paused rate hikes, they do continue to shrink their balance sheet. As of February 6, 2016, The Federal Reserve of New York further shrank The Fed’s Balance Sheet by $14.2 billion.
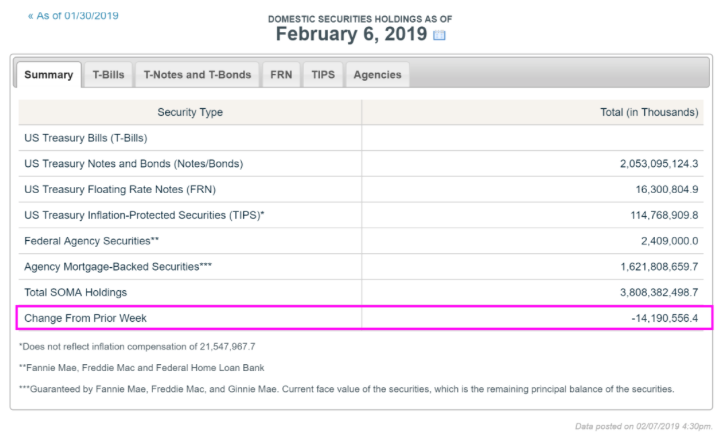
To-date, the Fed has unwound $434 billion of its balance sheet. But this comes as other central banks are still elevating their balance sheets. It is going to prove difficult to weaken the USD with other central banks proving to ease monetary policy further in 2019. Should the U.S. economy weaken further in 2019 and when compared to 2018, the Fed's balance sheet activity will be the next battle wagered between investors and the Fed.
Lastly, check out Finom Group's (for whom I am employed) Weekend Technical Market Recap.


