Are We There Yet?
Some are equating the current market decline to the equity market decline that occurred in October 1987. Urban Carmel, who writes at The Fat Pitch highlighted in commentary on Twitter, the market's action in 1987:
- "the S&P 500 Index fell 20% in one day, rose 15% the next 2 days, then returned to the low the following week."
- "then rose 15% again and retested the original low 6 weeks later,"
- "and finally the S&P 500 Index was up 25% a year later and back at prior highs 2 years later."
So what does that look like compared to today's market and has it arrived at a bottom?

History does not necessarily repeat exactly, but it is often said that it rhymes. If that is the case, the market may be nearing a bottom. As noted by Urban Carmel's comments above, a bottoming process may need to develop over a period of weeks like the six week period in 1987. Importantly though, the COVID-19 coronavirus issue will pass and the recent equity market pullback has been significant enough that investment opportunities are unfolding. One does not need to jump head first into all potential opportunities, but being selective can provide some rewarding investments for long term investors.
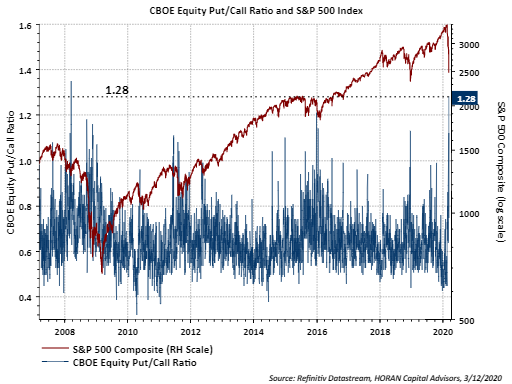
The S&P 500 Index is down over 26% from the high it reached on February 19. According to Ryan Detrick, Senior Strategist at LPL Research, this is the fastest decline from an all-time high to bear market, 16 days. The fastest decline had been held by the bear market that was reached in 30 days on October 28, 1929. A great deal of fear is present in the market and I have noted this in a few earlier post, the last one on Monday this week. Sentiment has become even more fearful or bearish since Monday with the VIX closing at 75.47 today, up from 54.5 on Monday, the CNN Business Fear & Greed Index stands at the extreme fear level of 2 today and down from 3 and the Equity Put Call Ratio closed at 1.28, up from 1.12 on Monday. Bearishness and fear are widespread.
The magnitude of the decline can also be seen in the below two charts that show the percentage of S&P 500 Index stocks trading above their 50 and 150 day moving averages. Essentially only a handful of stocks are trading above these averages. When these low levels are reached with these average figures, the bottom may not come immediately, but historically it has occurred very close to these washout periods.

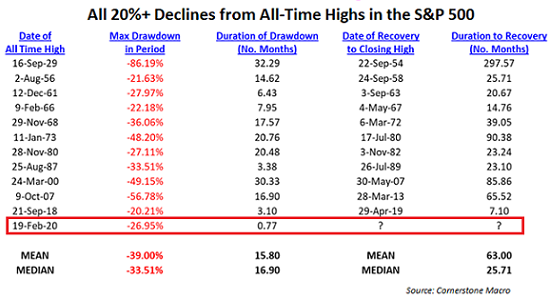
And finally, market recoveries can be uneven, The below table shows all 20+% declines from all-time highs with the last column noting the duration to reaching the earlier high. The 1929 period skews the average, but the median is a little over 25 months. Continued volatility is likely ahead of us, but investors that view equities as long term investments are beginning to see opportunities in companies given the equity market pullback.