
Are We In A Secular Bull Market?
Just recently, Jeff Saut from Raymond James made a very interesting statement with respect to the recent market decline.
“Speaking to last week’s Dow Theory sell signal, we really cannot decide to ignore it, as we did with two previous false sell signals, or honor it because we continue to believe this is a secular bull market.”
It is an interesting point and one that has been prognosticated by several Wall Street analysts and bloggers in recent months like Josh Brown who recently penned:
“If Ari is correct, then we are currently enduring a cyclical bear market but the secular bull market that began in 2013 with fresh S&P 500 record highs is still intact.”
Here is the problem with the analysis.
Secular markets, bull or bear, are not defined by price movements.
For example, if the market is down 20%, the technical definition of a “bear market”, then any rallies and subsequent declines that set new lows, are not defined as a “secular bear market.” It is just a “bear market” where prices are “trending” lower rather than “higher.”
What defines secular, or very long-term, markets are valuations.
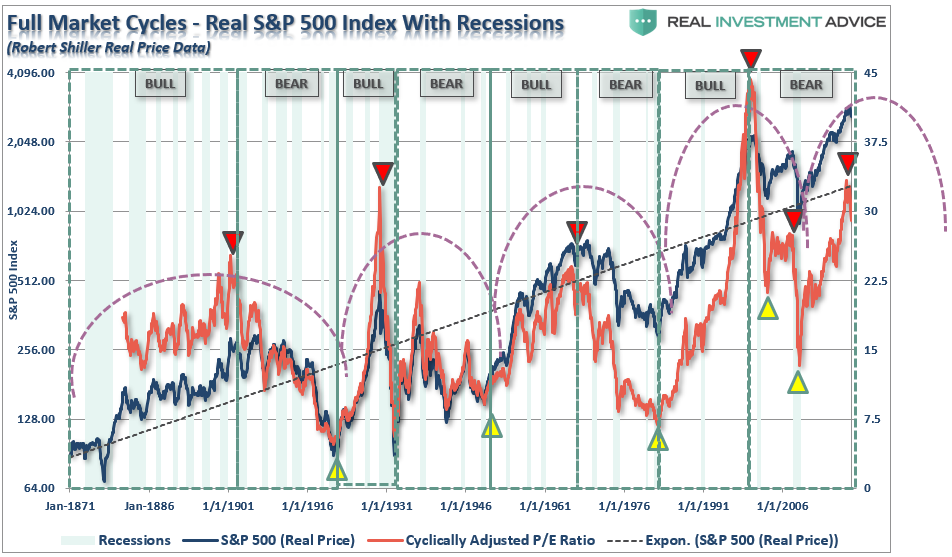
The chart below shows the history of secular bull market periods going back to 1871 using data from Dr. Robert Shiller. One thing you will notice is that secular bull markets tend to begin with valuations around 10x earnings and end at 23-25x earnings or greater. (Over the long-term valuations do matter.)
But, here is the other problem I have with both Josh and Jeff’s thesis of a price based breakout defining a new secular “bull” market.
The chart below compares the last secular “bear” market that ran from 1963 to 1982 as compared the current cycle. Notice the chart for this previous period stops in 1973. I will show you the rest of this period in a moment. Also, importantly, note the level of valuations.
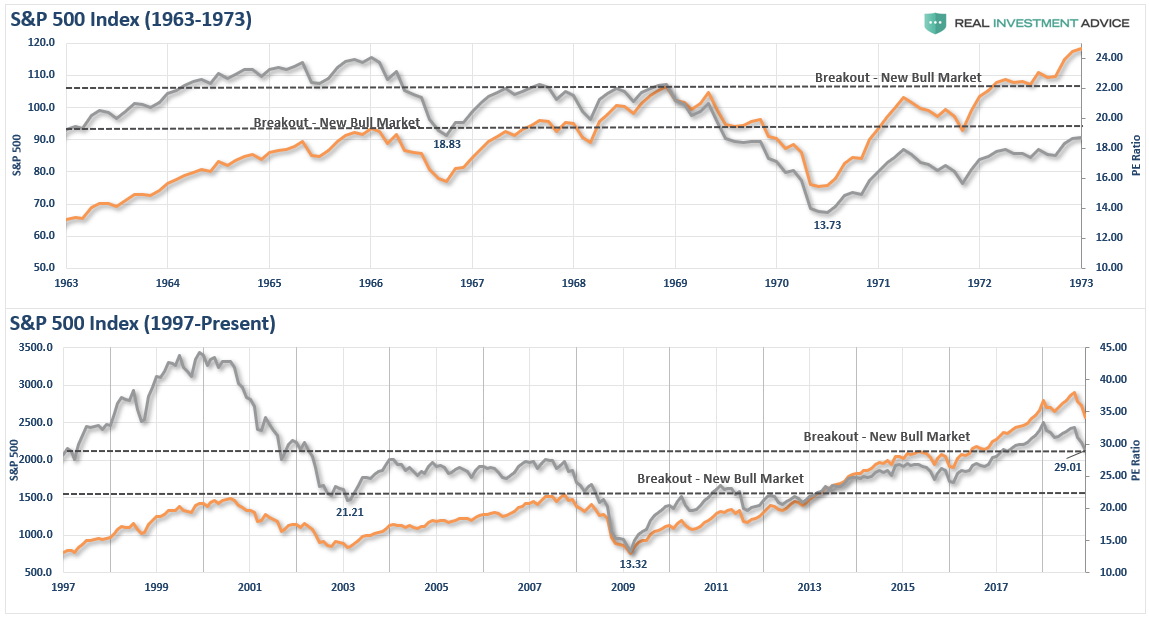
What is important, besides the very similar pattern between the two periods, is the breakout in 1969 did not start a new “secular” bull market. Rather, it was a setup for the next major decline.
“Okay, but the breakout in 1972 was surely the beginning of the new secular bull market – right?”
Not so fast.
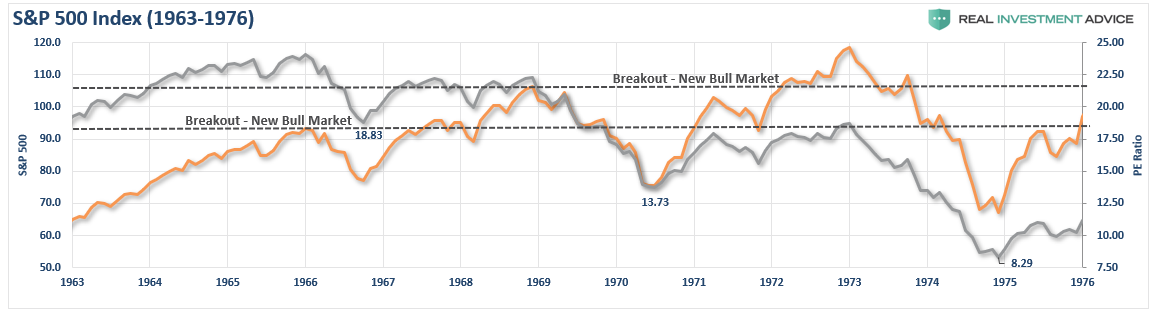
The second breakout in 1972, like the previous, was the setup for the final market dive that reset valuation levels back to historic secular bear market lows. That crash also created the necessary extreme negative in investor psychology. The 1974 bear market low was also known as a “black bear market” as investors were so brutally ravaged they did not return to the markets in earnest until nearly two decades later.
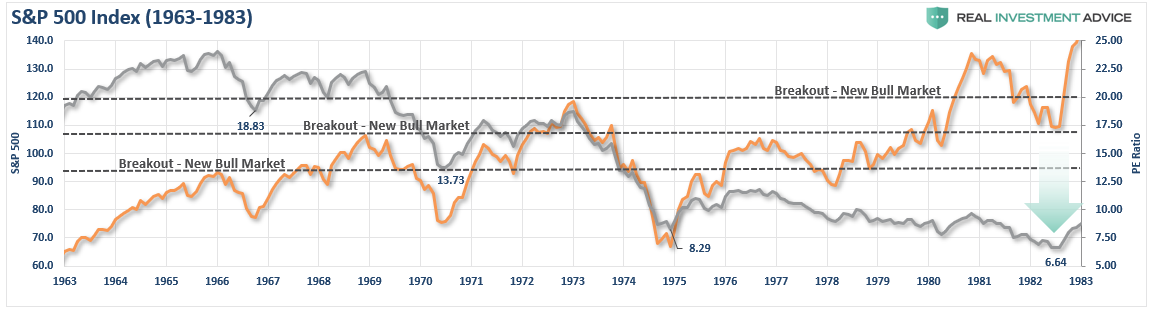
As noted above, it is not just price action that denotes secular bull and bear market periods.
It is valuations.
What drives long-term secular “bull” markets is “valuation expansion.” In order to have the magnitude of “valuation expansion” needed to support a secular “bull” market, you must both start at “under-valued” levels and have the economic factors and investor enthusiasm to support a return to “over-valued” levels.
The ability to have a “1982-2000 affair” is highly improbable. The 1982-2000 secular bull market cycle was driven primarily by a multiple expansion process which began with valuation levels of 5-7x earnings and a dividend yield of 5%. Interest rates and inflation were at extremely high levels and were at the beginning of a 40-year decline which would increase profitability as production and borrowing costs fell.
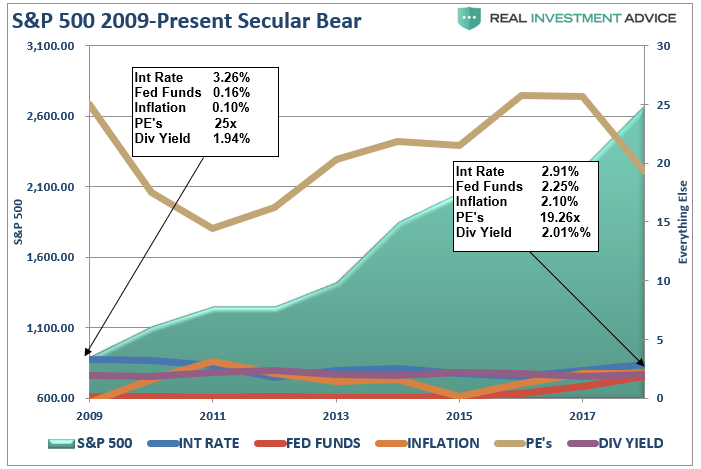
The first chart shows the secular bear market of the ’60s and ’70s with an overlay of valuations, dividends, interest rates and inflation.
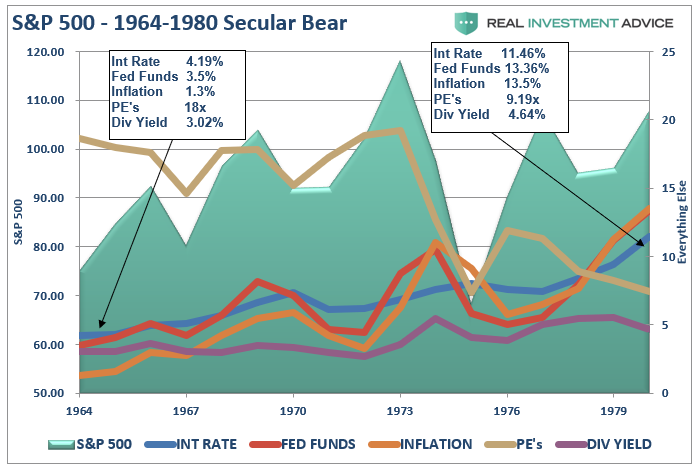
You will notice that at the beginning of the bear market in the 60’s valuations were high while everything else was low. By the end of the secular period, these factors were reversed.
Now, let’s juxtapose that previous period with the much beloved, and hoped for, secular bull market of the 1980s and ’90s.
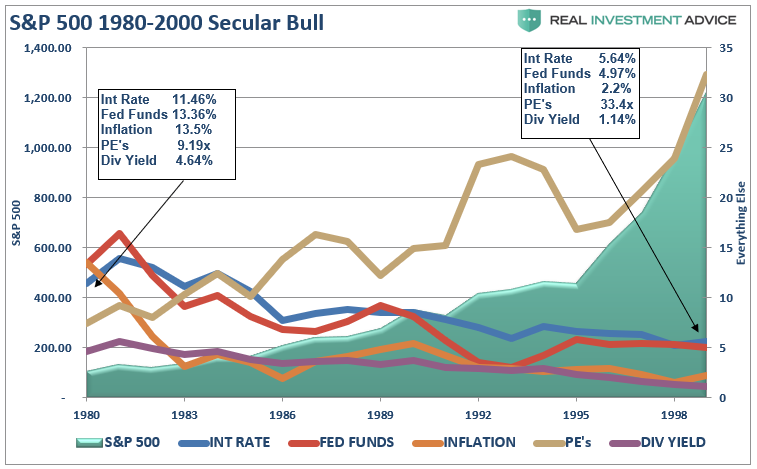
There were several contributing factors that drove that particular secular bull market:
- Inflation and interest rates were high and falling which boosted corporate profitability and reduced discounting factors making the value future earnings higher.
- The extreme negative sentiment of the late ’70s was finally undone by the early ’90s. (At the turn of the century roughly 80% of all individual investors in the market began investing after 1990. 80% of that total started after 1995 due to the investing innovations created by the Internet. The majority of these were “boomers.”)
- Large foreign net inflows to chase the “tech boom” drove prices to extreme levels.
- The mirage of consumer wealth, driven by declining inflation and interest rates and easy access to credit, inflated consumption, corporate profits, and economic growth.
- Corporate profits were boosted by the deregulation of industries, wage suppression, outsourcing, and productivity increases.
- Pension funding requirements and accounting standards were eased which increased corporate profits.
- Stock-based executive compensation was grossly expanded which led to more “accounting gimmickry” to sustain stock price levels.
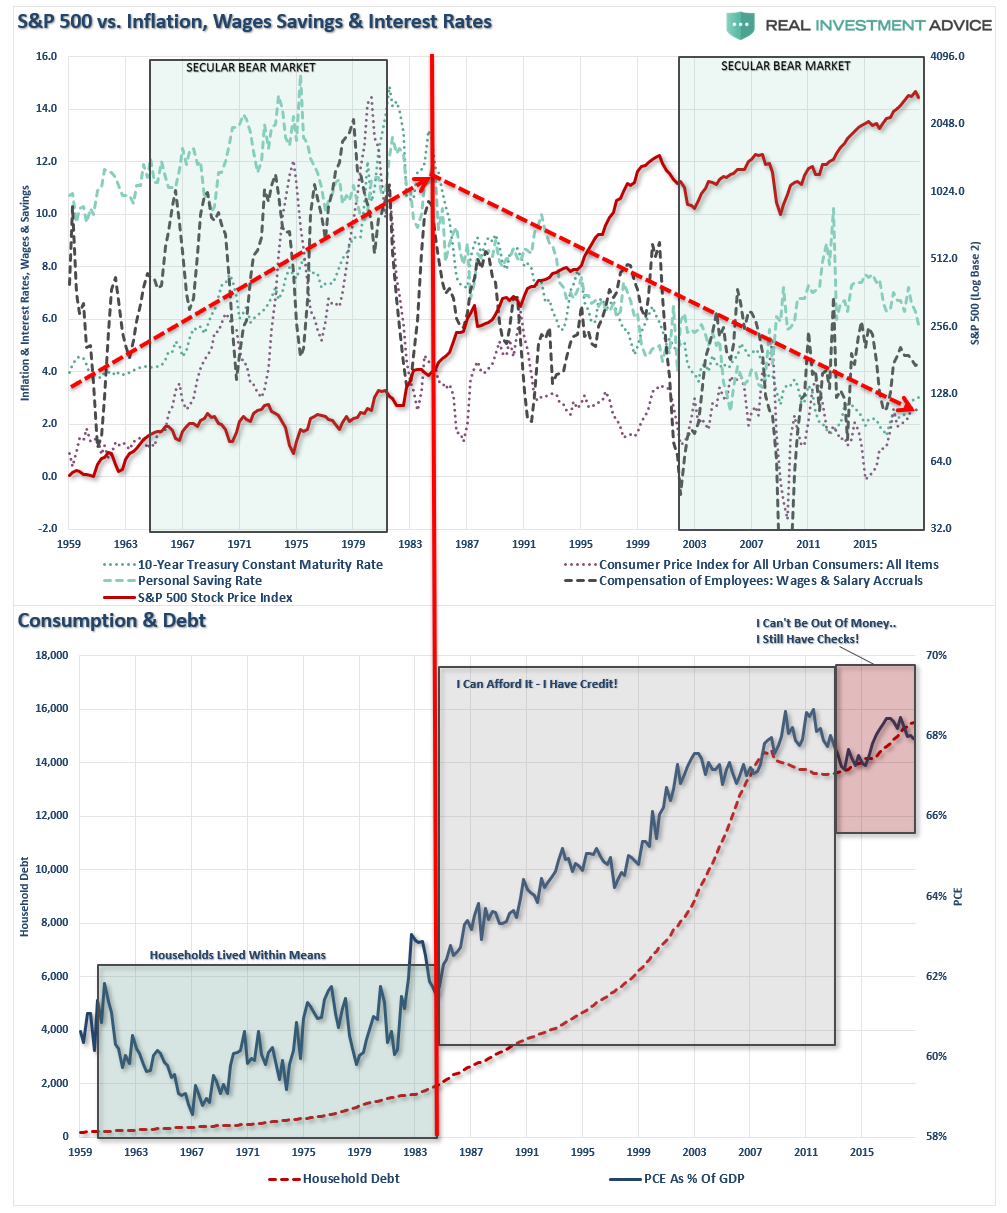
The dual panel chart below shows the economic fundamentals versus the S&P 500 and the change that occurred beginning in 1983. (Red dividing line)
We can simplify this by overlaying debt versus the underlying economic variables.
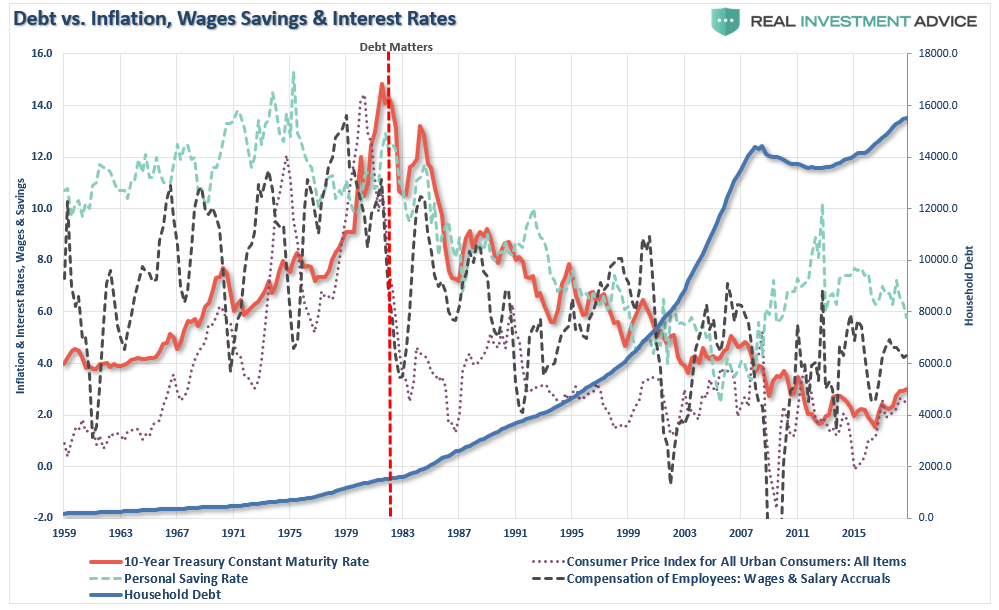
Currently, there is simply an inability to create the kind of debt-driven consumption growth seen during the ’80-’90s.
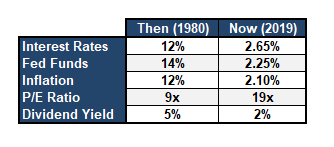
Despite much hope that the current breakout of the markets is the beginning of a new secular “bull” market – the economic and fundamental variables suggest otherwise. Valuations remain at very elevated levels which are the opposite of what has been seen previously. Interest rates, inflation, wages, and savings rates are all at historically low levels which are normally seen at the end of secular bull market periods, not the beginning of one.
The table below shows the difference between 1980 and today.
Lastly, the consumer, the main driver of the economy, will not be able to again become a significantly larger chunk of the economy. With savings low, income growth weak and debt back at record levels, the fundamental capacity to re-leverage to similar extremes is no longer available.
Let’s also not forget the singular most important fact.
The breakout of the markets in 2013 was not one based on organic economic fundamentals but rather through massive monetary interventions by Central Banks globally. The previous secular bull markets in our history we ones which were derived from extreme undervaluations, washed out financial markets, and extreme negative sentiment.
Such is clearly not the case today.
While stock prices can certainly be lofted higher by further monetary tinkering, the larger problem remains the inability for the economic variables to “replay the tape” of the ’80s and ’90s. At some point, the markets and the economy will have to process a “reset” to rebalance the financial equation.
However, it is precisely that reversion which will create the “set up” necessary to start the next great secular bull market. Unfortunately, as was seen at the bottom of the market in 1974, there will be few individual investors left to enjoy the beginning of that ride.
Disclosure: The information contained in this article should not be construed as financial or investment advice on any subject matter. Real Investment Advice is expressly disclaims all liability ...
more

