Are Top 10 Companies The Reason Behind Market Growth?
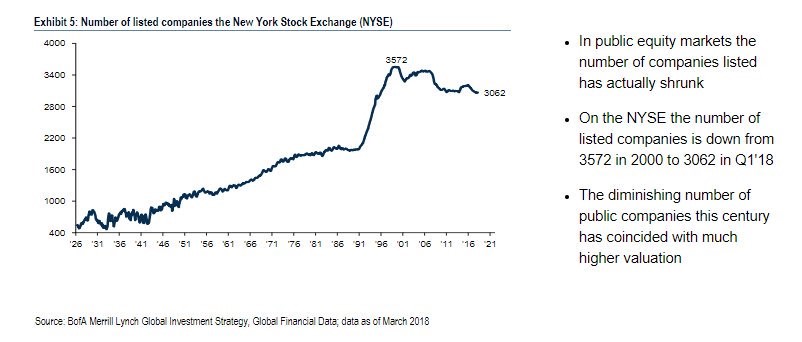
The number of American public companies is in decline. We have documented this trend in What The Number Of Public Companies Means. There has been an increase in concentration in many industries due to M&A activity. The giant internet firms, which have large moats, dominate their markets because they were early to market, invest a lot in capex and R&D, and have strong network effects. The chart below from Merrill Lynch gives us an updated look at the number of public companies listed on the New York Stock Exchange.
Source: Bank of America Merrill Lynch
There were 3,572 firms in 2000 and 3,062 as of Q1 2018. One thing worth noting about this chart is although the decline in the number of firms has correlated with a high CAPE ratio, the smaller number of public firms is not causing higher valuations. As we explained in a previous article, most of new equity issuances come from secondaries, not IPOs.
Unicorns Are Growing Very Quickly
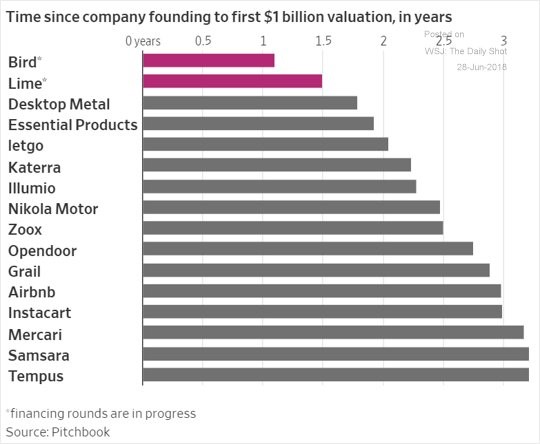
The increase in concentration that we mentioned in a previous article isn’t caused by the increase in private firms. However, it’s still notable how quickly tech startups are reaching high valuations. While the top tech firms such as Alphabet, Apple, and Amazon, look like they a significant competitive advantage in industries they compete, their moats may not be impossible to penetrate. The chart below shows how quickly the latest startup firms have reached $1 billion valuations.
Source: Pitchbook
Obviously, with inflation, it gets easier to reach higher valuations, but the principle reason for this trend is because firms can scale quickly. The winning formula is to spend as much money as possible to acquire customers and grow the business. Valuations rise because of the potential future profitability when monetization occurs. If a firm knows it can monetize customers in the future for more than it is spending in the present, it’s a good idea to keep spending. It’s also tax efficient since these losses pile up and they can be pulled forward. Clearly, firms enjoy staying private because of the regulatory hassle and the expense of going public. Plus, some of the unicorns which have become public are forced to focus on quarterly goals, and less so on the long-term.
Not An Unusual Market
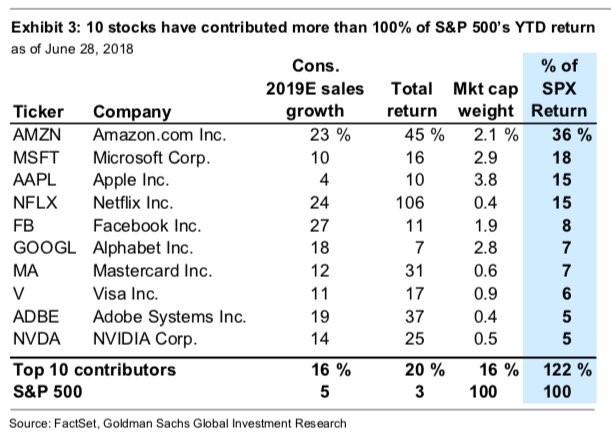
Even though we mentioned that the concentration of industries in the US has increased, the weighting in the S&P 500 isn’t abnormal. Bearish investors love to discuss how the biggest S&P 500 companies are larger than ever, however, that’s factually incorrect. The chart below is an example of data which causes readers to draw false conclusions.
Source: Goldman Sachs
As you can see, it shows the firms which have contributed the most to the S&P 500’s gains year to date. It makes it seem like the top 10 companies are driving more than all the returns of the market, which makes some investors conclude that the market is unsteady because it is driven by just a few companies.
Firstly, there are always leaders in the market. It’s usually good to have the fastest growing firms leading the market because if the value stocks with low growth are the leaders, it generally means the market is in ‘risk off’ mode and possibly going lower. Secondly, this is a misleading assumption because there are many stocks in the index which are down. You could add up all the stocks which have increased in the index and it will lead to much more than 122% of the gains. The way you can understand how this is misleading is that the equal-weighted S&P 500 was up 1.67% in the first half, while the normal market cap weighted index was up 2.52%. If only the top firms provided the gains, how come an equal-weighted index, which isn’t bolstered as much by the big cap firms like Amazon, Facebook, Microsoft, and Google, did nearly as well? It’s because the gains were broad-based.
If you were to look at a more inclusive index like the Russell 2000, it has done better than the S&P 500 as its total first-half returns were 7.66%. The gains this year aren’t only going to the large caps. Finally, since the first half S&P 500 total returns were low, it’s easy for a few firms to have a high percentage of the gains. If the market was up 0.1%, one stock could have well over 100% of the gains because the up stocks are being canceled out by the down stocks.
Review Of The Historical Weighting
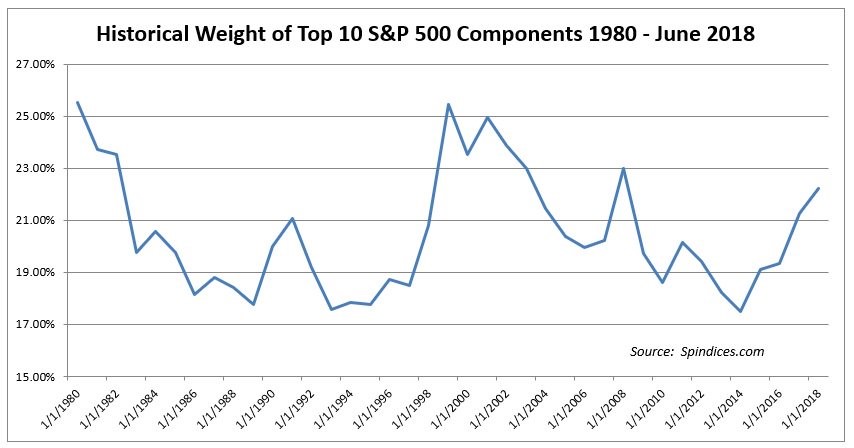
As we mentioned, the historical weighting of the S&P 500 isn’t abnormal. Even though the big tech firms are dominating their markets, they don’t have a bigger weighting in the S&P 500 than the big firms of the past did. The obvious comparison is the 1990s because that was the other period technology dominated the market. As you can see from the S&P indices chart below, the historical weighting of the top 10 firms was higher in the early 1980s, the late 1990s, the early 2000s, and 2008. It’s easy to fear the percentage, but it’s not large on a historical basis.
Source: S&P Dow Jones Indices
Just to show you that we aren’t playing with the numbers, the percentage weighting of the top 5 firms is low as well. The chart below goes further back showing that the top 5 firms had over a 25% weighting in the mid-1960s, while the top 5 firms currently have a 15.16% weighting. The point is that the market isn’t driven by a few firms any more than the past. However, we aren’t saying the market isn’t overvalued.
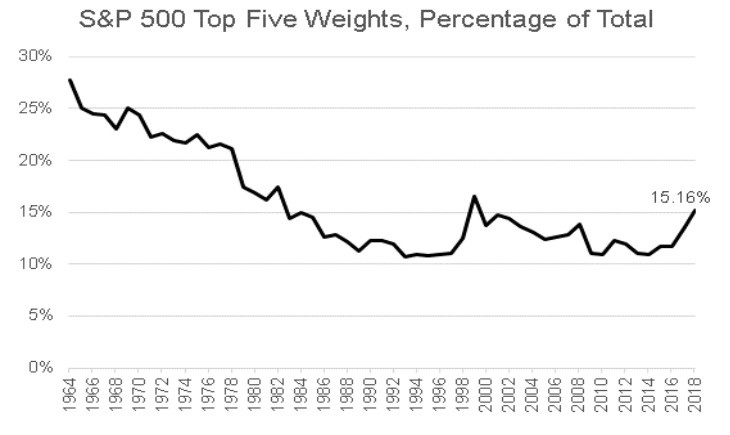
Source: S&P Dow Jones Indices
Conclusion
The goal of this article was to explain why the current market isn’t unstable in terms of weighting while explaining how that point doesn’t conflict with the increase in the concentration of industries. Like we stated, the market might be unstable because of excessive valuations. The third chart in this article shows how data can be misunderstood. We love to clarify misunderstandings. We will leave you with the Goldman Sachs chart below which shows the historical weighting of the biggest firm by market cap since 1974 (prior to 1974 it uses the percentage of net income).
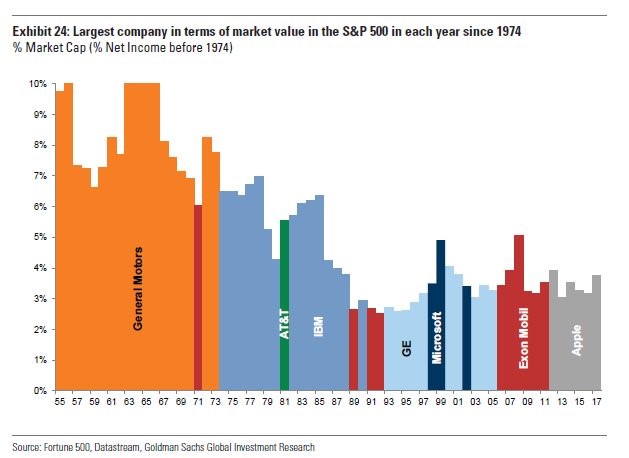
Source: Goldman Sachs
The weighting of the biggest firm has declined in the past few decades. The S&P 500 is less top heavy today than during the past.
Disclaimer: Please familiarize yourself with our full disclaimer here.


