
Are Stocks Primed To Breakout?
Market Outlook
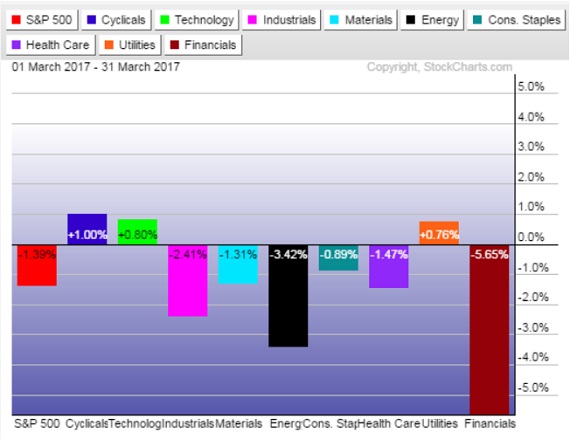
Jeff Hirsch in the Almanac Trader talks about how April marks the end of what is historically the best six months for DJIA and the S&P 500. April 1999 was the first month to gain 1000 DJIA points. However, from 2000 to 2005, “Tax” month was hit, declining in four of six years. Since 2006, April has been up eleven years in a row with an average gain of 2.6% to reclaim its position as the best DJIA month since 1950. April is second best for S&P and fourth best for Nasdaq (since 1971). Typical post-election blues have done little to damper April’s performance since 1953. April is DJIA’s second best month in post-election years, gaining 1.9% on average. April is fourth best for S&P 500 and Nasdaq. Although post-election year 2005 did suffer a 3% DJIA decline. You can see in the quarterly chart below how the market leader Nasdaq stocks has taken over as the best performer reaching all-time highs last week. The Nasdaq has led the overall market up and down for over a year and the move higher should be expected to positively impact the other equity indexes heading into quarterly earnings season. The chart below reflects uncertainty among traders – they are not willing to sell off equities, but not quite ready to commit to bidding prices higher. Also there is some sector rotation going which usually happens after a quarterly close and investors are waiting to see what earnings season looks like. In the current trading environment market neutral and short term directional trades have been profitable for us.
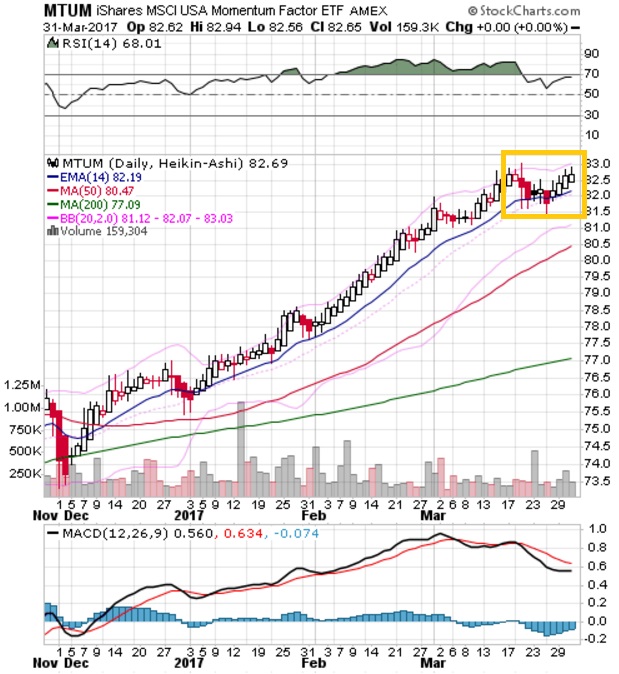
A standard chart that we use to help confirm the overall market trend is the Momentum Factor ETF (MTUM) chart. Momentum Factor ETF is an investment that seeks to track the investment results of an index composed of U.S. large- and mid-capitalization stocks exhibiting relatively higher price momentum. This type of momentum fund is considered a reliable proxy for the overall stock market trend. We prefer to use the Heikin-Ashi format to display the Momentum Factor ETF. Heikin-Ashi candlestick charts are designed to filter out volatility in an effort to better capture the true trend. Last week we said, “… given the recent behavior of the stock market, now the question appears to be whether the price trend will continue to move sideways or start turning down…” The response to this question is the trend continued moving sideways. The MTUM trading range is highlighted in the updated chart below. Now the question is will the price trend remain neutral or finally break through the top of the trading range? With the market leader Nasdaq Composite setting new all-time highs and earnings season starting up, the MTUM might be primed for a breakout which signals the next bull leg for the major indexes.
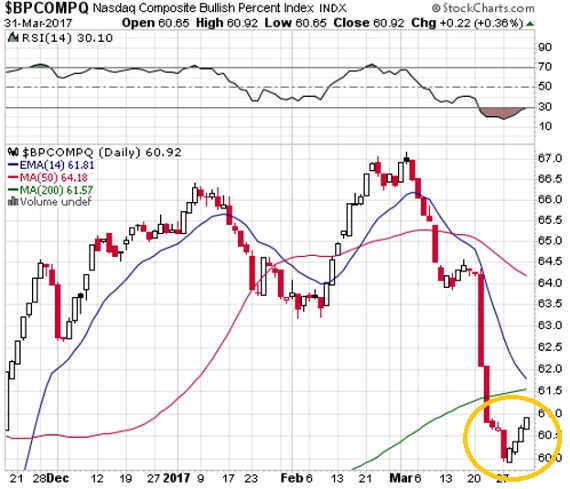
A tool to help confirm the overall market trend is the Bullish Percent Index (BPI). The Bullish Index is a popular market “breadth” indicator used to gauge the internal strength/weakness of the market. Like many of the technical market internal indicators, it is used both to confirm a move in the market and as a non-confirmation and therefore divergence indication. Nasdaq stocks have been leading the market direction for the past year. Recently we opined “…Until the BPCOMPQ recovers we don’t expect the equity market to start accelerating to new highs again…” Circled in the chart below you can see the BPCOMPQ is beginning a recovery bounce. In fact last week the Nasdaq Composite Index posted a record closing price. If the index follows up on its recovery bounce and continues higher, this might be a very strong signal that the other major indexes are set to break higher out of their recent trading ranges.
Disclaimer: Futures, Options, Mutual Fund, ETF and Equity trading have large potential rewards, but also large potential risk. You must be aware of the risks and be ...
more

