
Are Household Shelter Costs Increasing?
There is so much more to homebuying than just being able to afford it in the moment. It affects every aspect of a person’s life as it is a long term financial decision and a lifestyle choice. Focusing on having the right sized down payment, earning enough money in the prior two years to show the bank you can afford the mortgage payments, and having a high credit score so you get a good interest rate are the details that will get you in the house, but there’s more to moving than that.
Renters’ Interest In Home Buying
Home buyers want to set down roots which allow them to start a family, while renters want to have flexibility. If you rent and have kids in school, it won’t be easy if the landlord wants you to move out or increases your price. If you get a 30 year mortgage, you need to not only have a steady job for the past 2 years to afford it, but also keep that steady income for the life of the loan. In general (rule of thumb), you need to live in the house for 7 years before moving for it to be worth the costs associated with buying such as closing costs and moving expenses. It takes about 50 days on average to close on a home purchase, so doing that every few years is far from ideal.
Does #homeownership mean fulfilling a dream or taking on a financial burden? 45 percent of people surveyed here feel the latter: https://t.co/LJCOOAQJgI pic.twitter.com/SnftLcnwqW
— CoreLogic (@CoreLogicInc) February 18, 2019
As you can see from the chart above, 36% of renters stated home ownership means fulfilling a dream and raising a family. The concept of the ‘American dream’ is owning a home and starting a family. While there are many ways to achieve dreams and having a goal just because it’s in the national ethos isn’t ideal, owning a home grants you more autonomy as you can make renovations as you please and you can stay in it as long as you own it and pay property taxes. The group that wants to own a home is more likely to have kids, has higher income than renters overall, and is younger.
On the other hand, 45% in this CoreLogic poll stated owning a home means you have a long term financial commitment which can be a burden. When renting, you will always need to pay to live somewhere, so that expense will always be there. However, if you want to take a lesser paying job that you are more passionate about, you can do so by downsizing to a smaller rental house/apartment. Buying a home is the commitment to paying the bank interest for the life of the loan instead of compounding your investment returns (something we discussed in a previous article titled: Buying/Renting Home vs Investing In Stocks. The one negative is rent costs generally increase. A mortgage locks in your payments, which helps those who expect to see their salary increase. This group of renters who view home ownership as a burden are generally older, less likely to have kids, and have a lower income than average renters.
Shelter CPI Versus Median Household Income
The chart below shows the relationship between shelter CPI for all urban consumers and median household income for Americans. Both are non-seasonally adjusted.
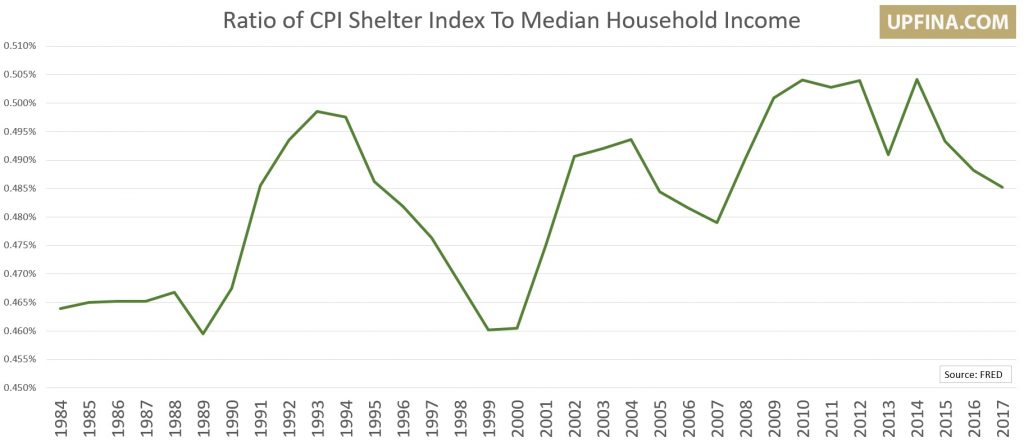
The specific ratio don’t matter because we are comparing an index with a dollar amount. However, the historical relationship has value as it shows how expensive shelter is in relation to median household income as compared with the past few cycles. As you can see, as of the last few years, shelter has gotten more affordable relative to household income, but it is more expensive than it was in the 1980s. The data from 2018 will be released in March 2019.
This data is much different from charts that compare average hourly earnings growth with shelter CPI. You can decide which relationship to follow. You should always try to look at information from multiple angles to get the best perspective. We will explain why this chart shows housing looking more affordable.
The growth in household income in the 1980s was helped by women entering the workplace. Average hourly earnings growth doesn’t take into account changes to the number of hours worked. Also, averages and medians can’t be compared easily. Because the labor market is near full employment, wage growth for low income workers has been higher than it has been middle and upper income workers, so median wage growth is higher than average wage growth. There is also faster growth in multiple income households as the unemployed get jobs.
Also faster wage growth at bottom. 6.5% for the bottom 10% in Q4-2018... pic.twitter.com/YCuGwrBXP5
— Tom Nabielec (@tnabielec) February 19, 2019
It’s important to note that not every area’s housing market is overvalued, so you shouldn’t expect shelter to be wildly unaffordable overall. The Midwest has affordable housing, while cities like San Jose don’t. Not every city has seen close to the price growth as Las Vegas.
Shelter inflation encompasses rent, homeownership equivalent rent, lodging away from home, and tenants’ & household insurance. Hopefully, this explanation of the chart helped you understand the data. When you understand each calculation, you won’t get tricked by charts that can accidentally distort information because people are naturally inclined to search for patterns.
Core CPI Versus Core CPI Ex-Shelter Inflation
Very recently we’ve seen rent and primary resident CPI decelerate modestly, but shelter inflation is still higher than core inflation. As you can see from the chart below, the cumulative gap between core CPI and core CPI ex-shelter this cycle is larger than last cycle. As we mentioned earlier, shelter inflation isn’t just housing prices.
Core ex housing chart. Sorry not too many charts today. Little harder to do remotely. pic.twitter.com/zrg2RdBSdF
— Michael Ashton (@inflation_guy) February 13, 2019
Millennials Aren’t Huge Job Switchers
One misnomer about millennials is they switch jobs all time and can’t commit to anything. The chart below shows millennials switch jobs less often than their predecessors in the 1970s-1990s.
Let's be clear: millennials are not "job hopping." Young adults aren't even switching jobs at anything close to the levels of those in their age groups before 2001. pic.twitter.com/YyteHquu6K
— Gray Kimbrough (@graykimbrough) January 27, 2019
It’s also important to note that when people are switching jobs a lot it’s a sign of a healthy labor market. Job switchers have higher wage growth than those who stay with the same job. Obviously, if a person is comfortable in an environment, switching might not make sense even if competing pay is better. Pay isn’t everything for most people.
Hirings Aren’t Happening
We already know based on the past few JOLTS reports that openings aren’t translating to as many hirings as usual. Openings were up 29.4% year over year in December and hires were up 7.1%. The difference between openings and hires was 1.428 million which was a new record. The chart below is great because it adjusts the data by the noninstitutional population.
What good are job “openings” if they’re never filled? Hires adjusted for population are below 2006 and even further short of 2001. #JOLTS pic.twitter.com/GTbcztmywO
— G.H. Burns, CFA (@GHBurnsCFA) February 12, 2019
Hires are below the 2006 level and further below the 2001 level while openings hit a record high. This means the labor market isn’t as great as those periods which can be interpreted as good news because it means there’s more labor supply in the labor market.
Conclusion
Buying a house versus renting isn’t just about what you can afford. It’s about whether you want to have kids and if you want to live in the same place for more than 7 years. Shelter CPI as a percentage of household income has been falling in the past few years. We reviewed the differences between this data and other calculations so you can decide for yourself which is more valuable. Understanding the data is valuable in itself even if you disagree with the chart’s conclusion. Millennials don’t switch jobs as much as previous generations, but they should. Hiring isn’t as high as the past 2 cycles when you adjust for the population, which could be a good thing because it means there’s more slack (supply) in the labor market.
UPFINA's Mission: The pursuit of truth in finance and economics to form an unbiased view of current events in order to understand human action, its causes and effects. Read about our more


