
Are Current Risk Levels For The US Stock Market Extraordinary?
Earlier this month we reviewed how recent performance for the S&P 500 Index stacked up relative to history. Let’s extend the analysis to risk. As we’ll see, deciding if risk is unusual, or not, depends on how you’re defining risk. As a result, there’s quite a bit more subjectivity in this corner or market analytics.
In contrast with return, risk comes in a wide range of flavors. That’s productive in the sense that investors can customize risk analytics with a high degree of specificity. The drawback: looking for a one-size-fits-all analysis is nigh impossible. A given risk reading, after all, can be perceived very differently by different investors. Despite the complication, let’s forge ahead and take a look at a trio of the usual suspects for a bit of preliminary context for the S&P 500 since 1960.
Let’s start with the standard view in academic finance: volatility. In this case, we’ll look at the annualized standard deviation of one-day returns for rolling five-year windows (1,260 trading days). The current volatility (as of Jan. 15, 2020) is 13.4%. As the chart below shows, that ranks as moderately tame—roughly half the level of vol that the market has experienced in terms of the highest print for the five-year window. Then again, S&P vol has, at times, been substantially lower, falling below 10% at times.

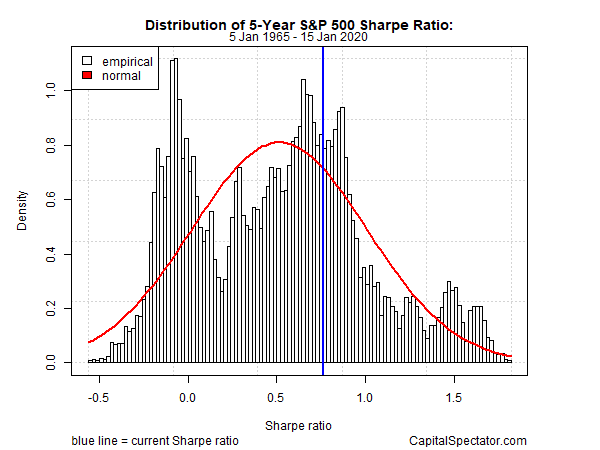
For another perspective, consider the Sharpe ratio, which adjusts return by way of volatility. Higher (lower) Sharpe ratios equate with higher (lower) risk-adjusted performance. Note that this calculation forgoes adjusting return for a risk-free rate and is based on rolling 5-year windows. The current reading: 0.76, which is a moderately high level. That’s a solid risk-adjusted performance, although history reminds that Sharpe ratios have been known to go much higher—in excess of 1.50 at times. On the flip side, Sharpe ratios have dipped into negative territory, which is arguably of no value in terms or risk assessment.
Finally, consider how drawdown stacks up for the S&P 500 through time. At the moment, the market’s at a record high (as of Jan. 15) and so current drawdown is 0%. In fact, drawdowns tend to cluster near 0%, which reflects the market’s tendency to rise and recover after corrections/bear markets. As such, drawdown’s distribution is heavily skewed and so it’s dramatically abnormal from the perspective of a normal distribution context. Relatively deep drawdowns occur, of course, but they’re unusual. Accordingly, the current 0% drawdown is closer to a typical reading vs., say a 20% peak-to-trough decline.

The main takeaway: risk appears relatively modest if not low, but deciding if that equates as typical, or atypical, is challenging since there’s a lot of subjectivity involved. All the more so when you consider that market risk cycles through time and so it’s reasonable to think of “low risk” as a precursor to “high risk” in the near future. Further complicating the risk-analysis task: there are many other metrics to consider, along with different rolling periods. Meanwhile, every investor thinks of risk in a different way that’s unique to her tolerance for financial pain, investment horizon, objectives, etc.
Risk analysis is critical, but ultimately it’s a mix of art and science and so one investor’s idea of a “low” risk reading may look like an accident waiting to happen to another set of eyes.
Disclosure: None.


