April 2021 Kansas City Fed Manufacturing Expands At A Faster Pace

The three regional manufacturing surveys released to date for April are in expansion.
Analyst Opinion of Kansas City Fed Manufacturing
Kansas City Fed manufacturing has been one of the more stable districts. Note that the key internals were positive. This survey should be considered about the same as last month.
New orders declined while the backlog grew.
Market expectations from Econoday were 19 to 28 (consensus 26). The reported value was 26. Any value below zero is in contraction.
Factory Activity Expanded Further
Tenth District manufacturing activity expanded further with the highest monthly composite reading in survey history, and expectations for future activity increased considerably (Chart 1, Tables 1 & 2). The index of prices paid for raw materials compared to a month ago also reached the highest level in survey history. In addition, finished goods prices expanded more from a month ago and a year ago. Materials price expectations for district firms over the next six months continued to rise, and many firms also expect higher finished goods prices.
The month-over-month composite index was 31 in April, an increase from 26 in March and 24 in February. (Tables 1 & 2). The composite index is an average of the production, new orders, employment, supplier delivery time, and raw materials inventory indexes. The growth in district manufacturing activity continued to be driven by higher activity levels at durable goods plants, especially for primary and fabricated metals, and transportation equipment manufacturing. Month-over-month indexes for production and employment reached record high levels in April. Shipments, employee workweek, order backlog, and new orders for exports expanded at a faster pace in April. New orders and supplier delivery time indexes remained very positive. Materials inventories rose significantly and finished goods inventories jumped back into positive territory for the first time since February 2020. Year-over-year factory indexes increased considerably in April, now comparable to the depths of the pandemic shutdown last year. The year-over-year composite index surged from 16 to 35, with all positive indexes indicating growth from this time last year. The future composite index was very high at 34, similar to previous months but with an uptick in expectations for new orders and employment.
Summary of all Federal Reserve Districts Manufacturing:
Richmond Fed (hyperlink to reports):
Dallas Fed (hyperlink to reports):
Philly Fed (hyperlink to reports):
New York Fed (hyperlink to reports):
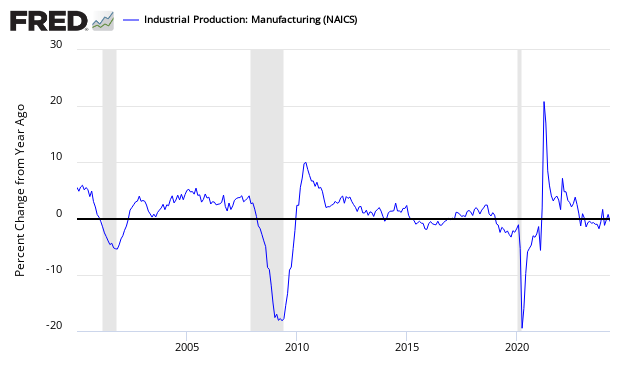
Federal Reserve Industrial Production - Actual Data (hyperlink to report):
Holding this and other survey's Econintersect follows accountable for their predictions, the following graph compares the hard data from Industrial Products manufacturing subindex (dark blue bar) and US Census manufacturing shipments (red bar) to the Kansas City Fed survey (light green bar).
Comparing Surveys to Hard Data:
In the above graphic, hard data is the long bars, and surveys are the short bars. The arrows on the left side are the key to growth or contraction.
Disclaimer: No content is to be construed as investment advise and all content is provided for informational purposes only.The reader is solely responsible for determining whether any investment, ...
more


