
Apple Warns, Will Downtrend Resume?
The U.S. stock market indexes gained 0.1-0.5% on Wednesday, extending their short-term fluctuations, as the investors' sentiment remained slightly bullish following the recent rebound. The S&P 500 index fell the lowest since the late April of 2017 and it traded 20.2% below September the 21st record high of 2,940.91 a week ago when it reached the new medium-term low of 2,346.58. Then the market rallied and got close to 2,500 mark. The Dow Jones Industrial Average gained 0.1% and the Nasdaq Composite gained 0.5% on Wednesday.
The nearest important level of resistance of the S&P 500 index remains at around 2,500-2,520, marked by the recent local highs. The resistance level is also at 2,530. On the other hand, the support level is at 2,450-2,470, marked by the short-term local lows. The level of support is also at 2,400-2,420.
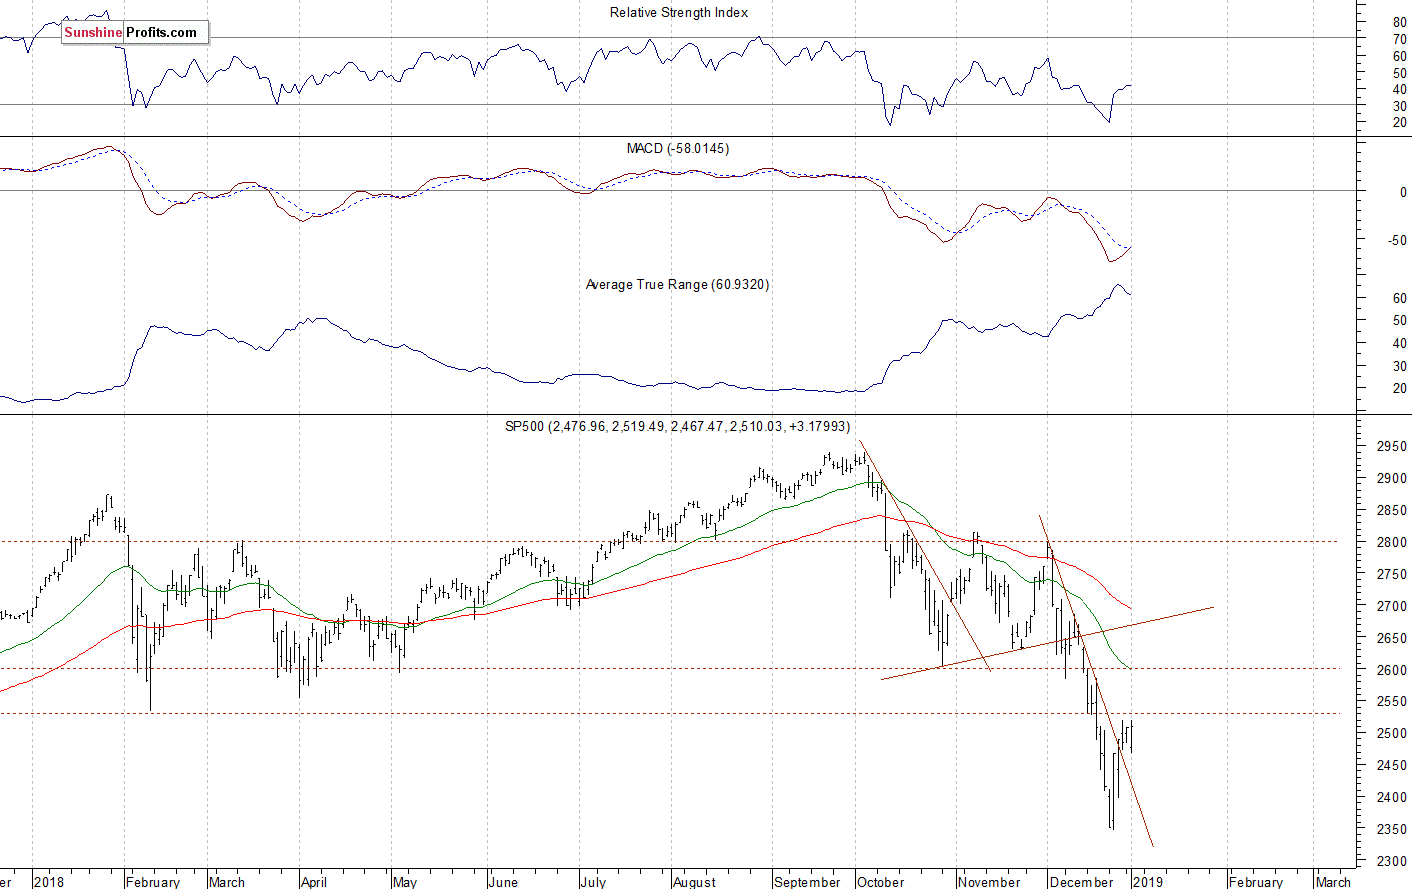
The broad stock market broke below its two-month-long trading range recently, as the S&P 500 indexfell below the level of 2,600. Then the market accelerated lower and it broke below the level of 2,400. The downward correction reached 20.2% from the September all-time high, surpassing January-February correction of around 12%. Is this a long-term bear market? It still looks like a medium-term downward correction, but the index remains below the recent consolidation, as we can see on the daily chart:
(Click on image to enlarge)
Negative Expectations Again
Expectations before the opening of today's trading session are very negative, because the index futures contracts trade 1.5-2.5% below their Wednesday's closing prices. The European stock market indexes have lost 0.5-1.7% so far. Investors will wait for some economic data announcements this morning: ADP Non-Farm Employment Change at 8:15 a.m., Initial Claims at 8:30 a.m., ISM Manufacturing PMI at 10:00 a.m. The broad stock market may retrace its yesterday's advance today and get back lower following yesterday's after-hours Apple's profit warning release. For now, it still looks like an upward correction within a downtrend.
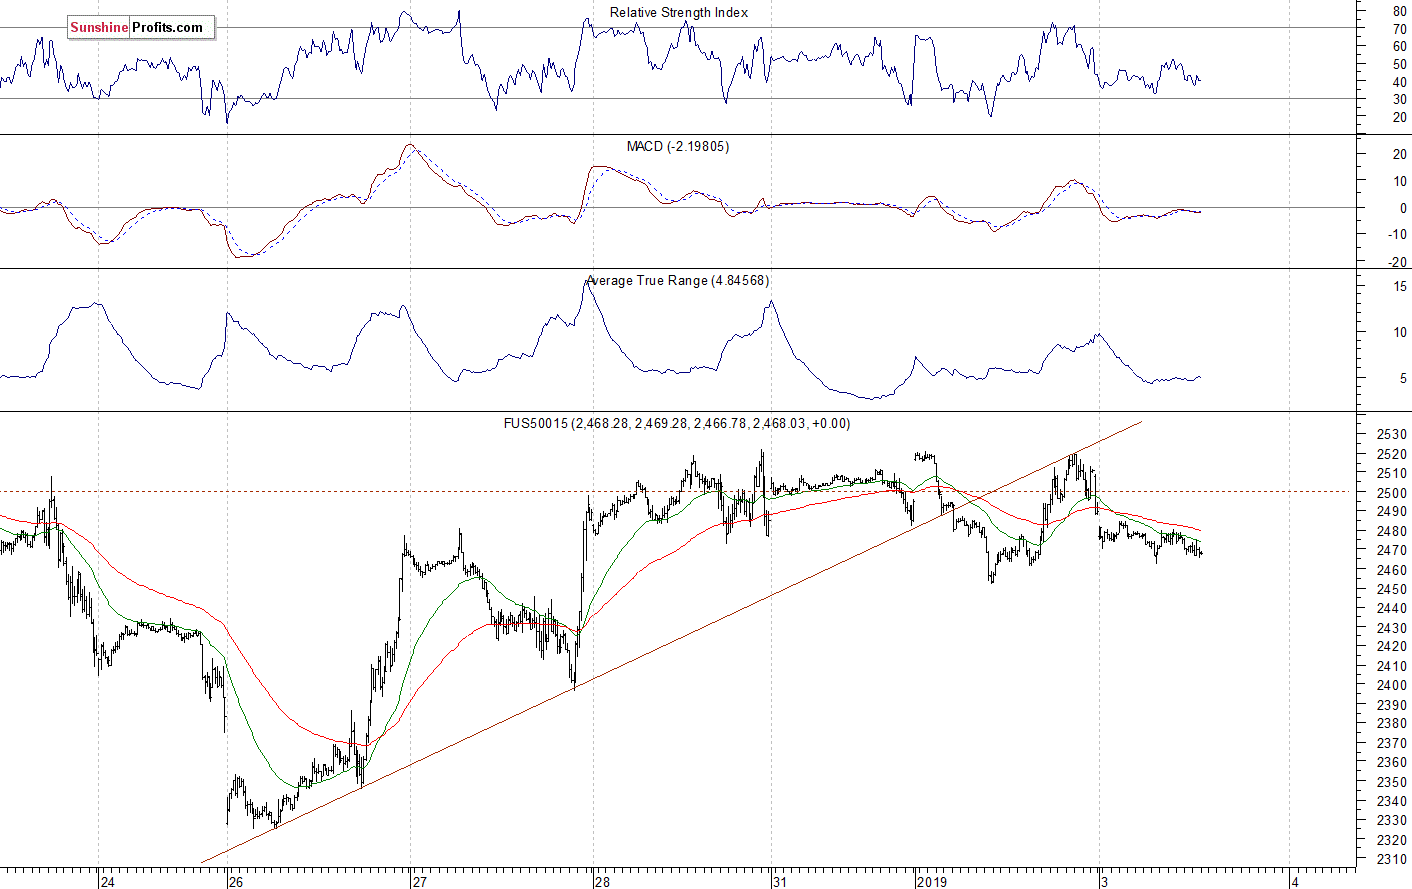
The S&P 500 futures contract trades within an intraday consolidation, as it fluctuates following an overnight decline. The nearest important level of resistance is at around 2,480-2,485, marked by some short-term local highs. On the other hand, the support level is at 2,450-2,460. The futures contract trades below the level of 2,500 again, as the 15-minute chart shows:
(Click on image to enlarge)
Nasdaq Back at 6,200
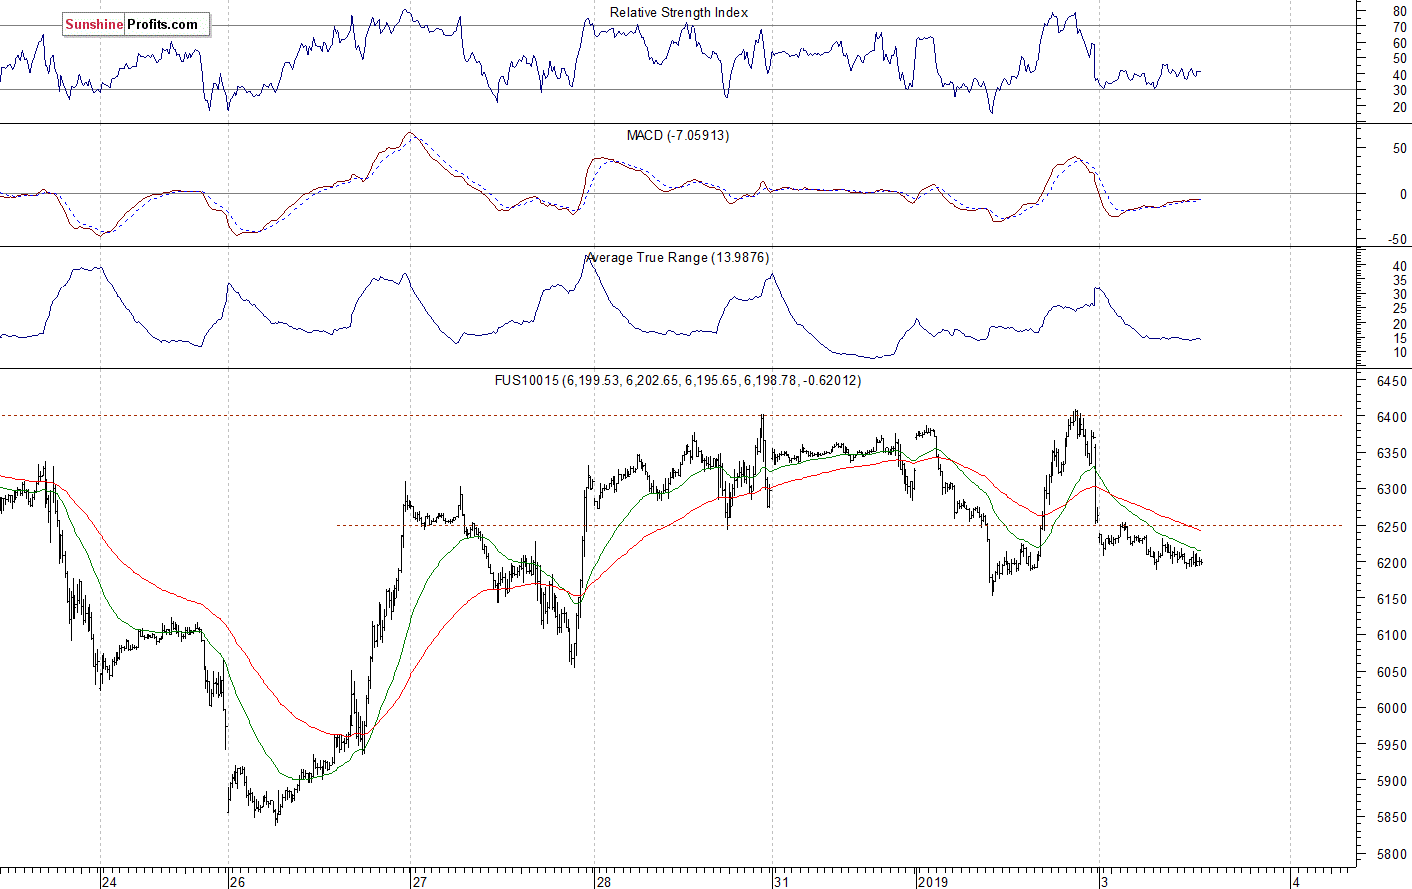
The technology Nasdaq 100 futures contract follows a similar path, as it trades within an intraday consolidation. The market bounced up to the level of 6,400 yesterday, but then it sold off after the mentioned profit warning release from Apple. The nearest important resistance level is at around 6,250-6,300. On the other hand, the support level remains at 6,000-6,150. The Nasdaq futures contract trades below its recent consolidation this morning, as we can see on the 15-minute chart:
(Click on image to enlarge)
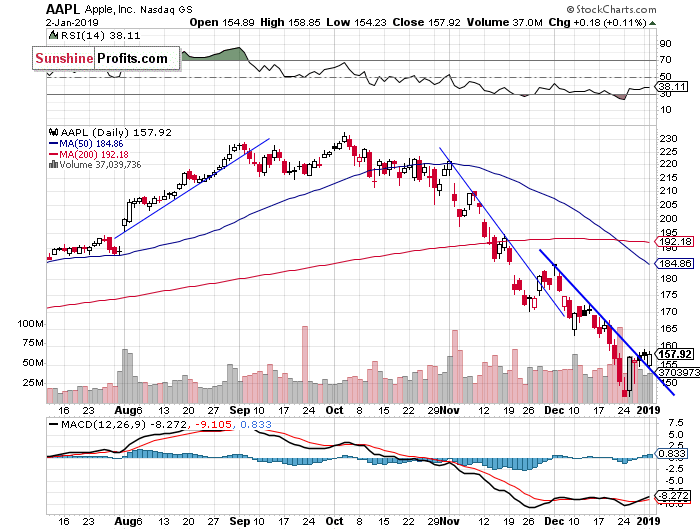
Apple's Crash
Let's take a look at Apple, Inc. stock (AAPL) daily chart (chart courtesy of http://stockcharts.com). The stock further accelerated its sell-off recently, as it fell below the price of $150. The market reached the new medium-term low of $146.59. Then it retraced some of the decline. The stock remained at its month-long downward trend line, but it will probably get back to the mentioned low today following a profit warning release. The stock is expected to open almost 9% lower.
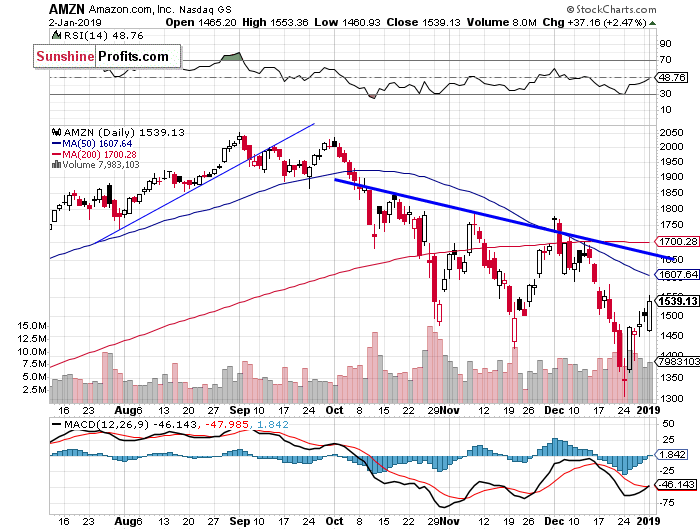
Now let's take a look at Amazon.com, Inc. stock (AMZN) daily chart. The stock accelerated its downtrend recently and it reached the new medium-term low of $1,307. Was last week's Wednesday's rally the upward reversal? For now, it looks like another upward correction. The market remains below its three-month-long downward trend line:
Dow Jones Remains Above 23,000
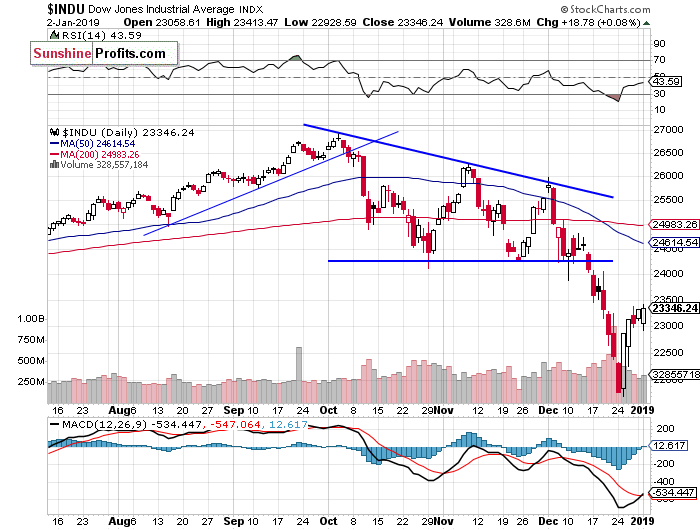
The Dow Jones Industrial Average broke below its two-month-long consolidation in the mid-December and then it accelerated much lower. The blue-chip stocks' gauge fell below the level of 22,000. It slightly extended the downtrend on Wednesday a week ago before sharply reversing higher and getting back to 23,000 mark. So was it an upward reversal or just a correction within a downtrend? The market remains below its October - December trading range:
The S&P 500 index extended its downtrend a week ago, before reversing higher. The broad stock market was more than 20% below its September's record high on Wednesday. Is this a new long-term bear market or just medium-term downward correction? For now, it looks like a correction. However, there have been no confirmed medium-term positive signals so far.
Concluding, the S&P 500 index will likely open lower today following a profit warning release from Apple. We may see more short-term volatility after last week's Monday's panic-selling climax followed by Wednesday's rally.
Disclosure: None.


