
Another Dire Warning For Stocks? It Was In 2000 & 2007
(Click on image to enlarge)
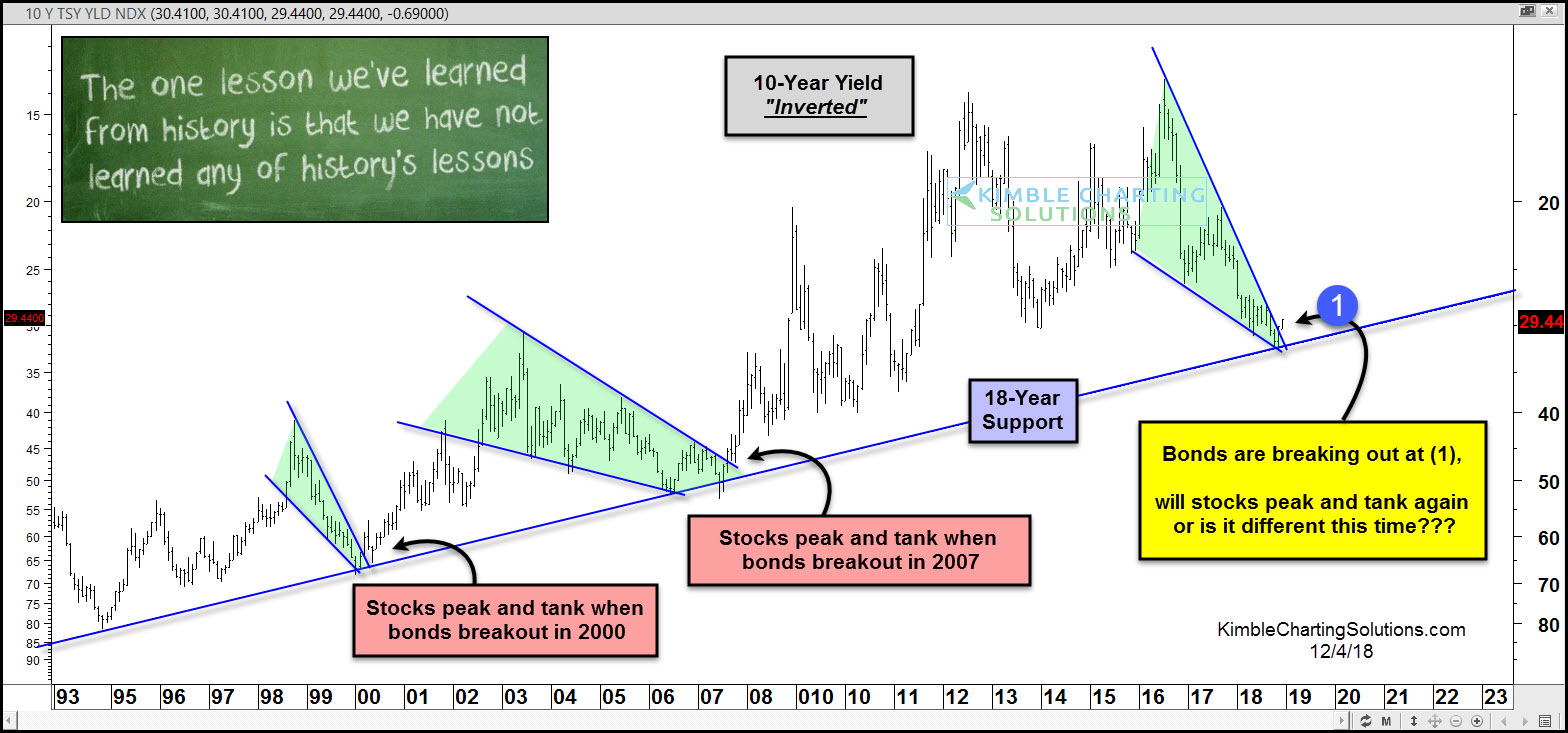
Are stocks receiving another dire warning, similar to the message received in 2000 & 2007? Very possible.
This chart looks at the yield on the 10-year yield, inverted. This chart now resembles bond prices. The inverted yield has remained above a key support line for the past 25-years.
In 2000 & 2007 the inverted yield created a bullish falling wedge, with the apex of the wedge at 25-year rising support. When a breakout took place in 2000 & 2007, stocks were peaking and they soon tanked.
The inverted yield has been falling hard the past few years, bringing it back to test 25-year rising support. Over the past couple of years, the inverted yield looks to be forming another bullish falling wedge, with the apex of the pattern taking place at support.
This week it is making an attempt to break out from this bullish pattern at (1), similar to the price movement in 2000 & 2007.
In 2000 & 2007 when breakouts took place, stocks peaked and tanked in the months ahead. Will it be different this time?
Sign up for Chris's Kimble Charting Solutions' email alerts--click here.


