
Another 52 Week High In Claims
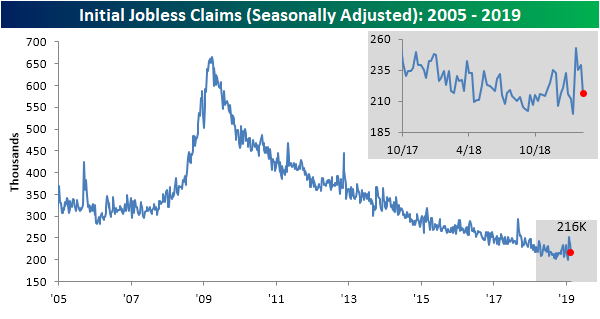
Initial Jobless Claims this week are giving a bit sigh of relief after a string of concerningly weak prints. On a seasonally adjusted basis, claims came in at 216K which was well below consensus expectations of 229K and also down from last week’s reading of 239K. Moving back down towards the lower end of the range the indicator has been at for much of the past year, the seasonally adjusted number has now spent a record 207 weeks under 300K.
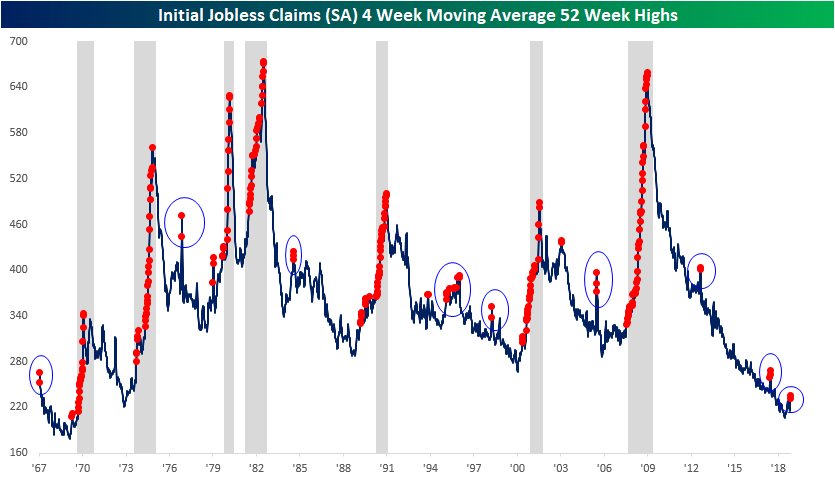
Turning to the four-week moving average, a less volatile measure of the high-frequency indicator, the picture has not improved despite the healthier looking SA number. The moving average once again hit a 52-week high this week with a 235.75K print; up about 4K from last week. That was the highest reading since January 19th of last year. This week’s uptick was largely predictable as a result of the very low 200K SA number from mid-January rolling off of the average. Given that another very high print like the 253K reading from late January is not expected, we may see the inverse effect next week.

As we mentioned in last week’s Bespoke Report, while a 52-week high in the indicator is not necessarily the end of the world, consistent releases at a year’s high are concerning as it is a coincident recessionary indicator. Given this is only the second straight 52-week high, there is certainly no need to sound the alarms just yet. As shown below, there are several occurrences of the multiple 52-week highs in a short span outside of recessions. If the indicator continues on for several more consecutive weeks or months, then it would be much more of a concern.
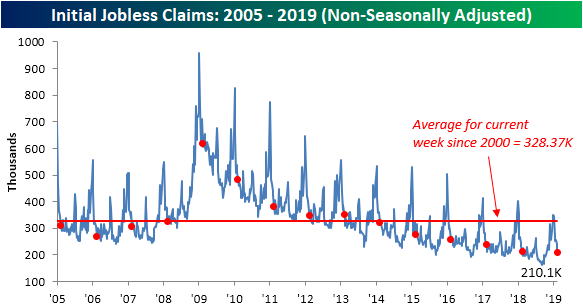
Finally, turning to the non-seasonally adjusted data, claims came in at 210.1K versus last week’s print of 242.8K. This week-over-week drop is right in line with seasonal patterns seen throughout the history of the indicator. This week’s data is also well below the average for the current week since 2000 (328.37K). It also came in as the lowest reading for the current week in the past several years; granted it is only 2K below last year’s print for the same week.
Disclaimer: To begin receiving both our technical and fundamental analysis of the natural gas market on a daily basis, and view our various models breaking down weather by natural gas demand ...
more

