
Analyzing Portfolios With Risk-Factor Profiles
Most investment portfolios are a collection of risk factors, such as exposure to credit and equity risk. Monitoring and managing these factors is critical. The standard approach is reviewing portfolios through a plain-vanilla asset allocation lens – 60% stocks, 30% bonds, 10% cash, for instance. But the standard methodology is a blunt instrument. For a clearer view of what’s driving your portfolio, decomposing risk with factor-based analysis offers a higher level of insight.
The stakes are high because the sources of risk and return in a portfolio can remain hidden in a conventionally designed asset-allocation review. That’s a problem for the simple reason that if you’re in the dark about the risk profile of your investment strategy, effective risk management is harder and perhaps even impossible. Fortunately, there’s a solution.
Decomposing risk can take many forms. The basic approach is analyzing a portfolio based on its components. A basic risk-contribution profile via funds, for instance, is usually a good way to begin (as an example, see my discussion here). But a security based review merely scratches the surface. Knowing that one ETF in your strategy is the source of 60% of the portfolio’s return volatility, or that three funds represent 90% of vol, is useful information. But each conventionally designed fund is really a mix of factors, which means you have to go deeper to identify the real sources of risk and return. That’s where factor-based analysis (FBA) comes in.
Conceptually, FBA is straightforward. Select a bunch of relevant risk factors and regress those factors against the return premiums on a portfolio’s holdings. In practice, however, the details can be tricky and so it’s best to have a clear idea of your goals before you start crunching the numbers.
The main issue is deciding what risk factors are relevant for the portfolio under scrutiny. This is where most of the heavy lifting will be done. For instance, are you focused mainly on macroeconomic factors, such as inflation, the business cycle, and so on? Alternatively, you can emphasize financial factors, such as value and growth factors for equities, and term and default factors for bonds. Or maybe it’s wise to combine macroeconomic and financial factors. Although there are some common-sense guidelines to follow, a wide range of customization is possible for selecting factors, depending on the portfolio and investment objective.
As a toy example, let’s decompose two highly rated (via Morningstar) multi-asset class mutual funds: Vanguard STAR (VGSTX) and Leuthold Core Investment (LCORX) using data from 2000 forward. The Vanguard fund is relatively tame, skewing toward a quasi buy-and-hold strategy across a broad spectrum of global stocks and bonds. The Leuthold portfolio, by contrast, is far more active, favoring a tactical asset allocation methodology. Let’s see how the two funds compare when we run the numbers through a factor-analysis grinder.
The first order of business is deciding which factors to use. In an actual consulting project I’d spend a fair amount of time on R&D on this point, but in the interests of brevity here let’s choose seven well-known factors for the analysis:
- US equity risk (VFINX less 3-mo T-bill return)
- Foreign developed-market equity risk (VTMGX less 3-mo T-bill return)
- Emerging-market equity risk (VEIEX less 3-mo T-bill return)
- REITs risk (VGSIX less 3-mo T-bill return)
- High-yield bond spread (BofA ML US High Yield Option-Adjusted Spread)
- Crude oil (price return)
- Treasury spread (10-year yield less 2-year yield)
Let’s recognize that the seven factors above probably aren’t the ideal match for a factor-based analysis of VGSTX and LCORX, but for illustrative purposes they’ll suffice.
The first step is looking at the ANOVA results (i.e, the analysis of variance) for a quick overview. (Note: I’m using R here and throughout.) Let’s start with VGSTX:
|
1 2 3 4 5 6 7 8 9 10 11 12 13 14 15 16 |
|
The analysis shows that the beta for US stocks is the strongest influence with a beta of roughly 0.43, and it’s statistically significant too, as noted by the three asterisks in the far right-hand column in connection with the p-value score. Foreign developed-market stocks are the second highest influence, with a beta of 0.18. Clearly, this is a portfolio that’s dominated by equity risk.
For comparison, here’s LCORX’s ANOVA data:
|
1 2 3 4 5 6 7 8 9 10 11 12 13 14 15 16 |
|
Here, too, the biggest risk factors for LCORX are US and foreign developed-market equities.
As useful as ANOVA is, however, it has a flaw: it’s a single snapshot of the risk profile, in this case over a long period of time (2000 through early 2017). Measuring risk in one fell swoop is problematic because it doesn’t offer a real-world measure of how a portfolio evolves through time. We can and should remedy that obstacle by reviewing rolling data. Specifically, let’s look at how the seven factor risks change through time based on a rolling one year basis, starting with the Vanguard STAR fund:
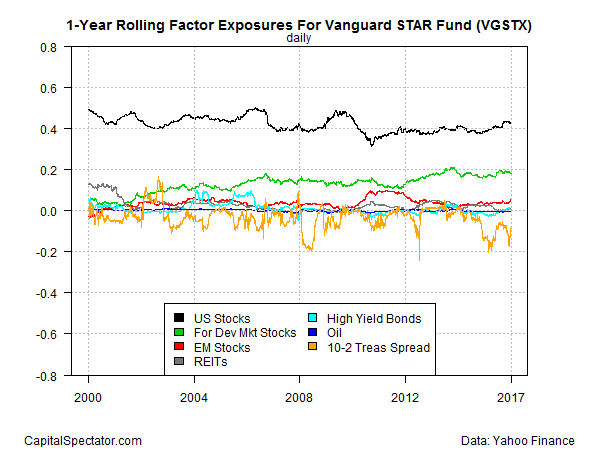
As you can see in the chart above, the risk exposures for VGSTX have been relatively steady. The black line at the top, for instance, is the US equity beta, which has remained in a range of roughly 0.3 to 0.5. Meanwhile, foreign developed equity risk has been slowly creeping higher in recent years (green line). Overall, this is a fund that keeps risk exposures in a fairly tight range.
It’s a different story for LCORX, as the next chart shows:
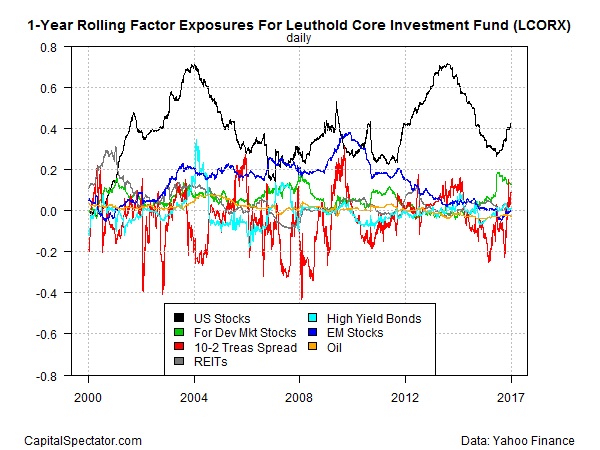
Clearly, the risk exposures for Leuthold Core Investment bounce around quite a bit. The US equity beta (black line), for instance, has ranged from as high as 0.8 down to 0.2. Meanwhile, exposure to emerging-market equity beta (dark blue line) has faded in recent years after reaching nearly 0.4 directly following the 2008 financial crisis.
In short, the two funds above have substantially different strategies for managing risk. We already knew that to a degree, based on the published mandates for each fund. But quantifying the different approaches to risk, and monitoring it real time, is revealing for understanding how the funds operate and deciding if the investment strategy is still acceptable for a given investment mandate. Simply put, profiling risk in this way goes a long way in keeping guesswork to a minimum when it comes to deciding if a strategy is evolving as expected.
This type of analysis is no less relevant for analyzing privately run portfolios, perhaps more so, since the underlying strategy is customized and therefore subjected to less scrutiny in the wider world.
You can’t spend too much time diagnosing the sources of risk and return. Indeed, decomposing risk factors for a multi-asset class portfolio can sometimes dispense surprising results, such as alerting an investor or financial advisor to unintentional increases or decreases in risk exposure or pointing out changes in strategy that aren’t obvious otherwise.
The key lesson: you can see a lot just by looking, which is another way of reminding us that we may be flying blind if we’re not running risk-factor profiles on a regular basis.
Disclosure: None.


