
An Opportunity For Volatility Bears
Following futures positions of non-commercials are as of March 17, 2020.
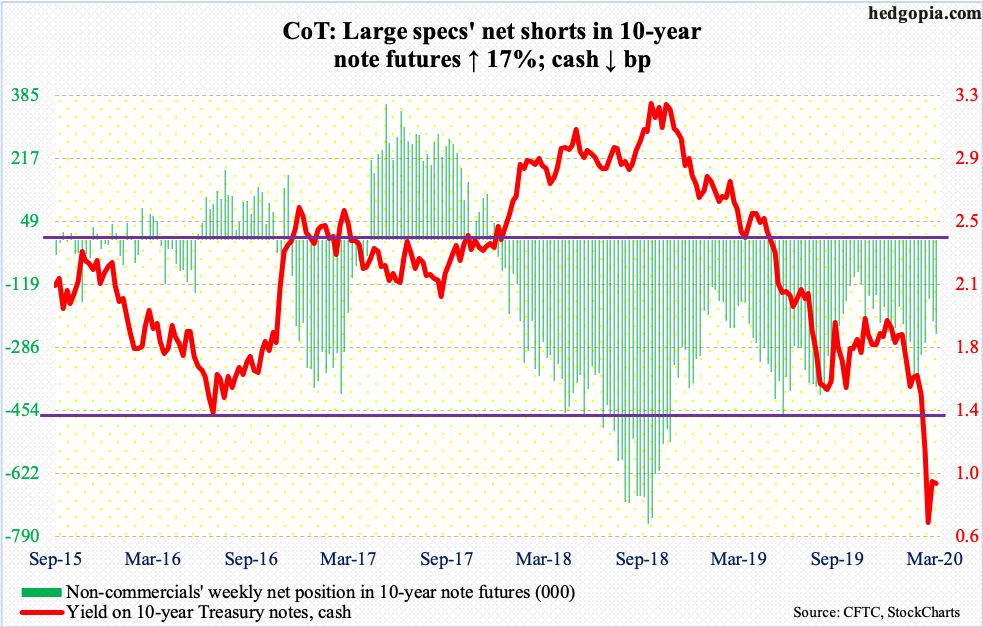
10-year note: Currently net short 251.1k, up 36.5k.
On Sunday, while cutting the fed funds rate by 100 basis points to zero-bound, the Fed also committed to purchase $500 billion in Treasuries and another $200 billion in mortgage-backed securities over coming months. The goal was to lower rates, and to quote Chair Jerome Powell, to “restore market functioning.” Things quite did not quite pan out that way – at least not right away.
Monday, the 10-year Treasury yield closed at 0.73 percent. (SPTL) By Wednesday, it tagged 1.27 percent, before coming under pressure and ending the week at 0.94 percent. This recalcitrant behavior was similar to how equities reacted to the 50-basis-point cut – also intra-meeting – on March 3. On the 2nd, the S&P 500 closed at 3090.23. This week, it closed at 2304.92.
It is too soon to declare that markets have lost conviction in the Fed’s prowess, or, for that matter, in major central banks. But these recent developments are definitely a chink in the ‘do not fight the Fed’ armor.
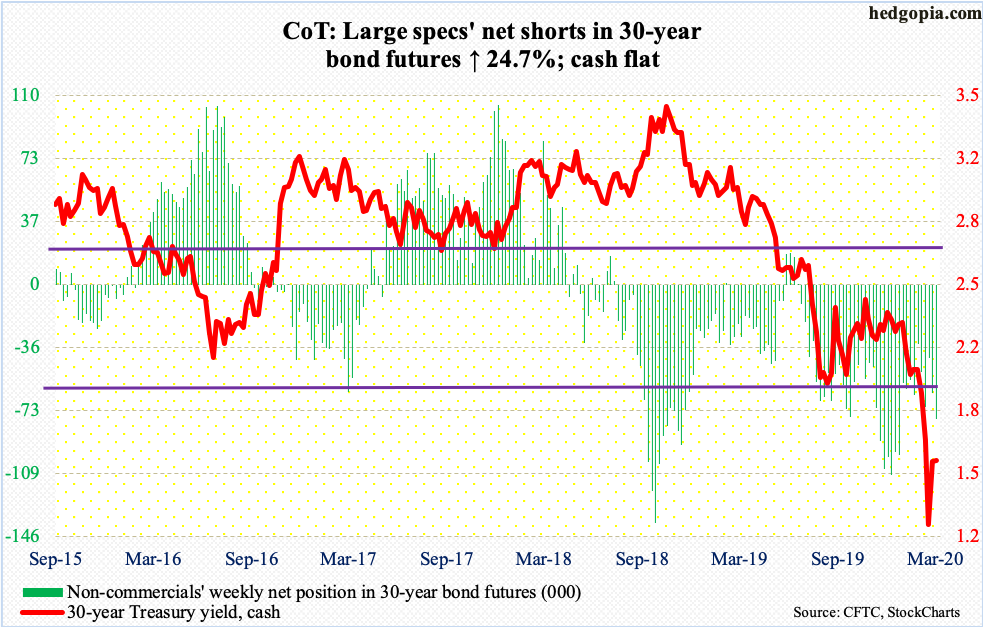
30-year bond: Currently net short 78.1k, up 15.4k. (TYX)
Major economic releases next week are as follows.
New home sales (February) are due out Tuesday. Sales jumped 7.9 percent month-over-month in January to a seasonally adjusted annual rate of 764,000 units – the highest since July 2007.
Durable goods orders (February) are scheduled for Wednesday. Orders for non-defense capital goods ex-aircraft – proxy for business capex plans – rose 0.9 percent year-over-year to $69.6 billion (SAAR). Orders peaked at $70 billion in July 2018.
GDP (4Q19, final estimate) and corporate profits (4Q19) will be published Thursday.
The second estimate showed real GDP grew at a rate of 2.1 percent in 4Q19.
Corporate profits adjusted for inventory and capital consumption fell 1.2 percent y/y in 3Q19 to $2.08 trillion (SAAR). Profits peaked as far back as 3Q14 at $2.19 trillion.
Friday brings personal income/spending (February) and the University of Michigan’s consumer sentiment index (March, final).
In the 12 months to January, core PCE – the Fed’s favorite measure of consumer inflation – rose 1.6 percent. In the current cycle through January – that is 127 months – this metric increased with a two handle in only 11 months.
Preliminarily, consumer sentiment dropped 5.1 points m/m in March to 95.9. Except for last August’s 89.8, sentiment has remained north of 90 since November 2016, five of whom were 100 or higher.
WTI crude oil: Currently net long 592.1k, up 49.2k. (OIL)
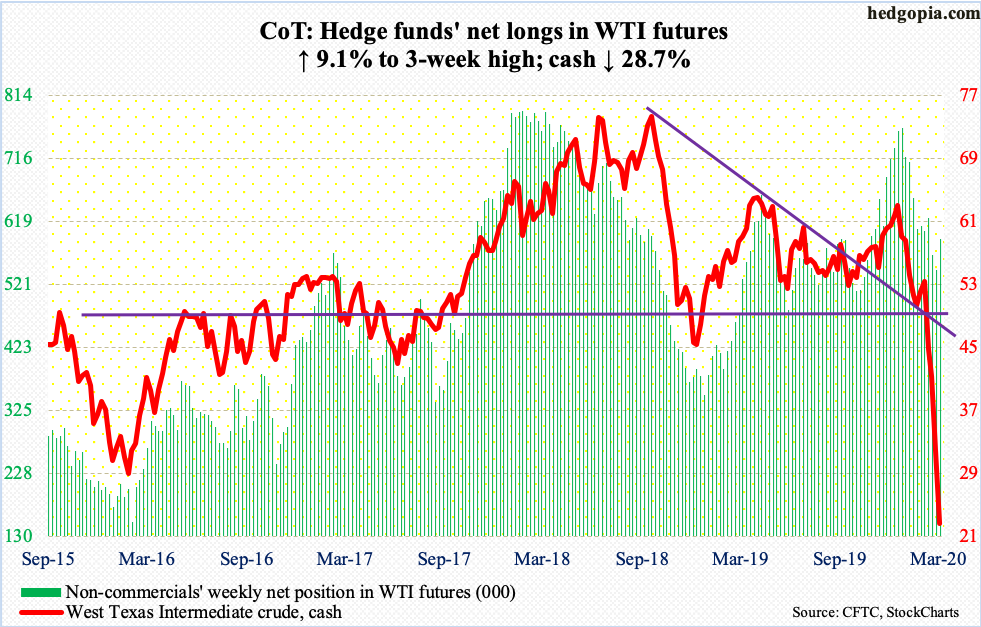
After three days of declines, the cash ($22.63/barrel) shot up 24.4 percent on Thursday. Even after this, it was down 28.8 percent for the week. From the January 8th intraday high of $65.65 through Wednesday’s low of $20.52, it collapsed nearly 69 percent. This week’s low was the lowest since February 2002.
The crude is in the midst of both supply and demand shock. Even as the coronavirus threatens to devastate the global economy, OPEC+’s failure to agree on output cuts early this month has major producers such as Saudi Arabia and Russia doubling down on production. The U.S. already pumps a record amount of crude globally.
The collapse in the price obviously has increased vulnerability of high-cost producers – both nations and companies – including U.S. shale producers. Hence the adverse reaction in oil stocks. Needless to say, WTI remains grossly oversold but downward momentum is yet to break. Rally attempts this week were denied at $28. After this, there is resistance in low-$30s, followed by gap-down resistance at $35.
In the week to March 13, the EIA report showed U.S. crude production rose 100,000 barrels/day to 13.1 million b/d, matching a record from two weeks ago. Crude imports rose as well, up 127,000 b/d to 6.5 mb/d, as did crude stocks, which increased two million barrels to 453.7 million barrels. Both gasoline and distillate stocks, however, fell by 6.2 million barrels and 2.9 million barrels respectively to 240.8 million barrels and 125.1 million barrels. Refinery utilization was unchanged at 86.4 percent.
E-mini S&P 500: Currently net long 17k, up 18.6k.
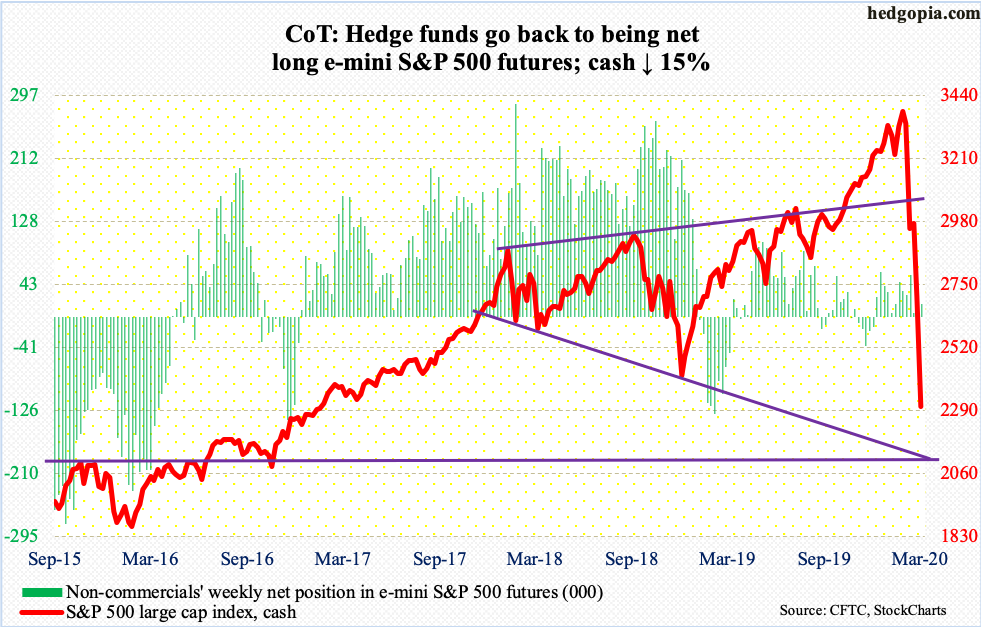
Wednesday, the cash undercut the December 2018 low by nearly three percent before bids started showing up, resulting in a candle with a long lower wick. This was followed by a daily spinning top Thursday. Come Friday, selling continued, down 4.3 percent.
In the week to Wednesday, SPY (SPDR S&P 500 ETF), VOO (Vanguard S&P 500 ETF) and IVV (iShares Core S&P 500 ETF) together gained $6.2 billion (courtesy of ETF.com). But these ETFs also took in $2.4 billion in the prior week, which is under water. US-based equity funds, on the other hand, continued to bleed – $14.8 billion in the week to Wednesday versus $4.2 billion in the prior week (courtesy of Lipper). In the meantime, money-market assets surged $158.6 billion week-over-week to $3.94 trillion – a new record. As far as bulls are concerned, this is dry powder.
Their problem is broken technicals. During the one-month carnage, one after another support gave way. In the overnight futures market, rally attempts have been sold near 2500. This is the first hurdle for now. On the downside, there is major support just north of 2100.
Euro: Currently net long 32.5k, up 45.2k. (FXE)
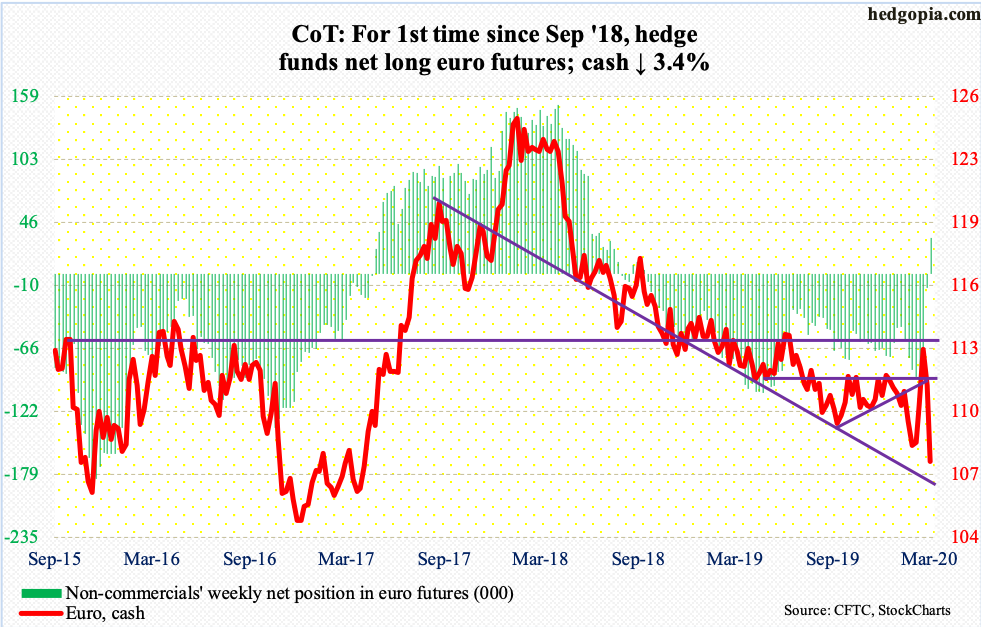
In just a couple of weeks, the cash ($107.50) dropped over seven percent – a huge move for a major currency. Both Thursday and Friday, the euro tested a falling trend line from July 2017, with Friday forming a potentially bullish hammer reversal.
Thursday’s action reflected the massive €750-billion stimulus plan announced Wednesday by the ECB, under which it will purchase sovereign and corporate bonds as well as commercial paper by year-end.
Nearest resistance lies at $107.80s.
Gold: Currently net long 281.9k, down 17.6k. (GLD)
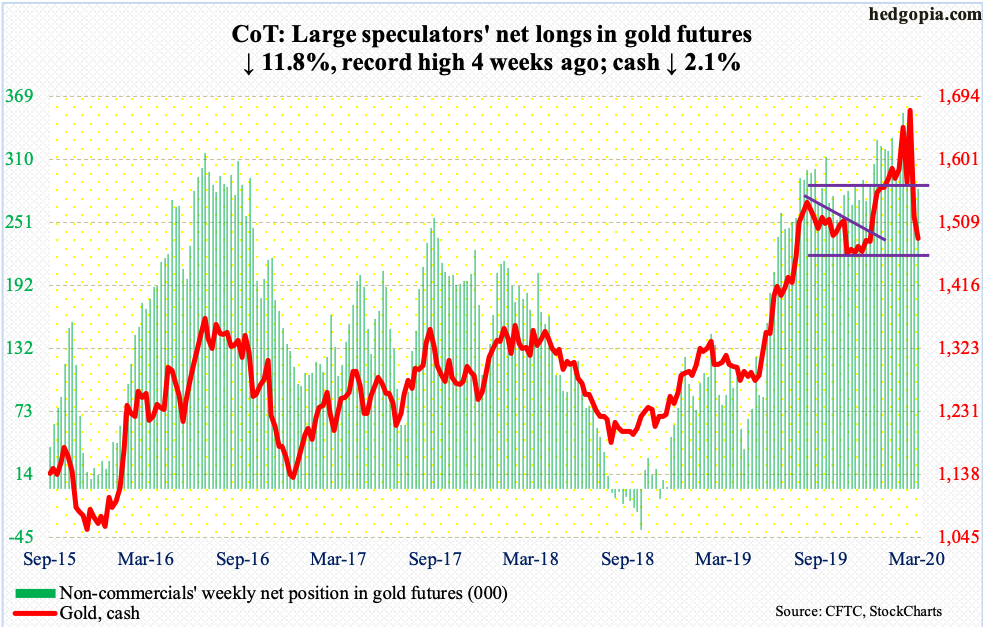
In just six sessions intraday through Monday, the cash ($1,484.60/ounce) collapsed nearly 15 percent. This at a time of a carnage in risk assets. Gold was supposed to act like a safe haven in times like this. But it itself acted like a risk asset.
To be fair, everything got hammered the last couple of weeks – from bonds to oil to crypto to copper to stocks. Plus, before the metal peaked on the 9th at $1,704.30, it rallied nearly 18 percent in four months.
Gold is below the 200-day at $1,500.83. If there is any silver lining in this, it is that support at $1,440s-50s was tested this week – successfully. Right above lies resistance at $1,520s. For a test to occur, gold-focused ETFs need to behave.
In the week to Wednesday, IAU (iShares Gold Trust) lost $338 million and GLD (SPDR Gold ETF) $1.5 billion (courtesy of ETF.com). The other group to watch closely are non-commercials, who are massively net long gold futures.
Nasdaq 100 index (mini): Currently net long 22.4k, up 4.7k. (NDX)
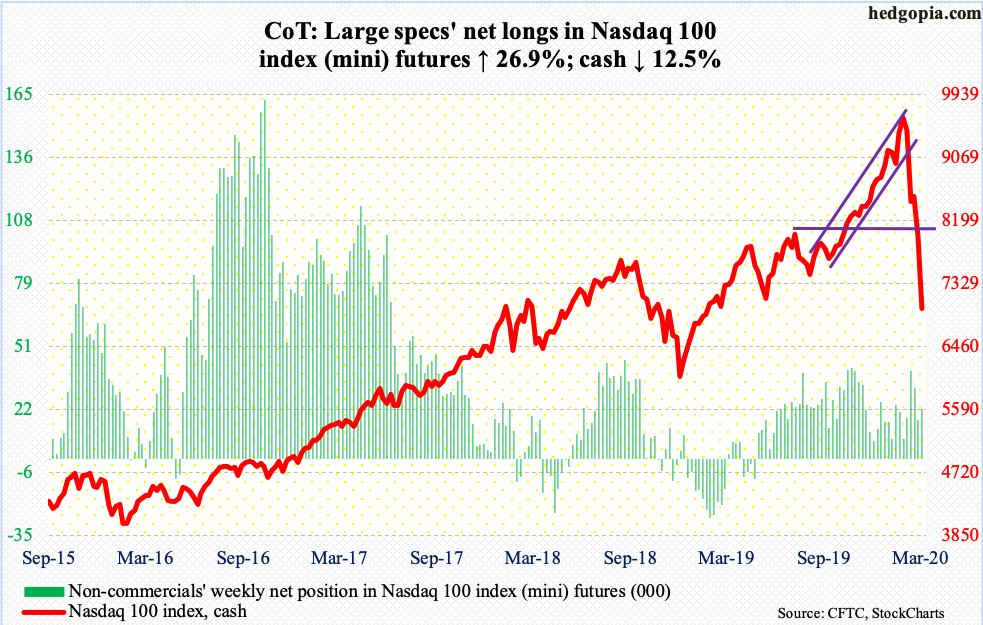
Tech stocks are holding their own – relatively speaking. Intraday, from its high of 9736.57 on February 19 through Wednesday’s low of 6837.53, the cash (6994.29) dropped just under 30 percent – better than its major U.S. peers. That low never undercut the December 2019 low, which was still nearly 14 percent away.
Flows cooperated. In the week through Wednesday, QQQ (Invesco QQQ Trust) gained $2.1 billion (courtesy of ETF.com).
But the fact remains that shorter-term averages are still sharply dropping. As consolation for bulls, even though the Nasdaq 100 dropped 12.5 percent this week, there was some sideways action on the daily. They can build on this provided this week’s low is not breached.
Russell 2000 mini-index: Currently net short 15.8k, up 37.8k. (IWM)
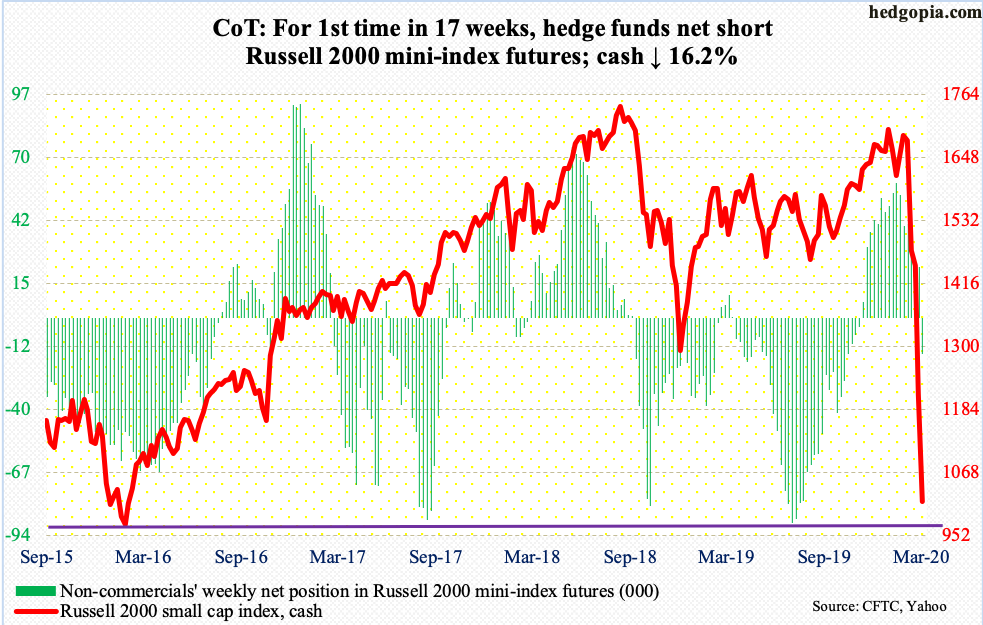
In February 2016, the cash (1013.89) formed a major bottom at 943.10 intraday. The rally that followed ended in August 2018 when the Russell 2000 small cap index peaked at 1742.09. It peaked much earlier than its large-cap peers.
In the latest selloff, too, small caps substantially underperformed, with the index collapsing 44.5 percent from its record high and over 43 percent just from February 20th. Amidst this carnage, from small-cap bulls’ perspective, the good thing is that the February 2016 low held. Wednesday, the Russell 2000 made an intraday low of 966.22, which was tested again Thursday before ending the session up 6.8 percent. This action potentially is a green shoot.
In the week to Wednesday, IWM (iShares Russell 2000 ETF) attracted $953 million, while IJR (iShares Core S&P Small-Cap ETF) lost $368 million (courtesy of ETF.com).
US Dollar Index: Currently net long 7.2k, down 5.3k. (UUP)
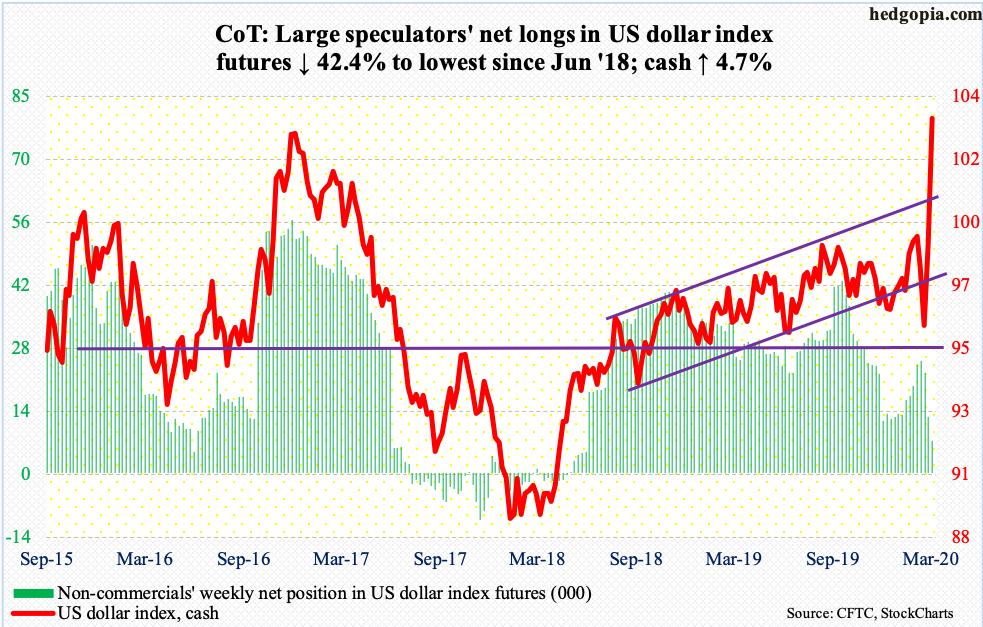
Since bottoming on March 9 at 94.61 through Friday’s high of 103.82, the cash (103.50) shot up just under 10 percent. Suddenly, the greenback was either treated as a safe haven or this was yet another sign of how fragile markets had become. The rally in the US dollar index came even as the fed funds rate was cut by 125 basis points between March 3 and 15 in two emergency meetings.
Friday’s high exactly matched the prior high from January 2017. A decisive breakout here will be massive and will not be good news for emerging markets, where businesses tend to borrow in U.S. dollars as well as export commodities priced in dollars.
VIX: Currently net short 79.5k, up 16.2k. (VIX)
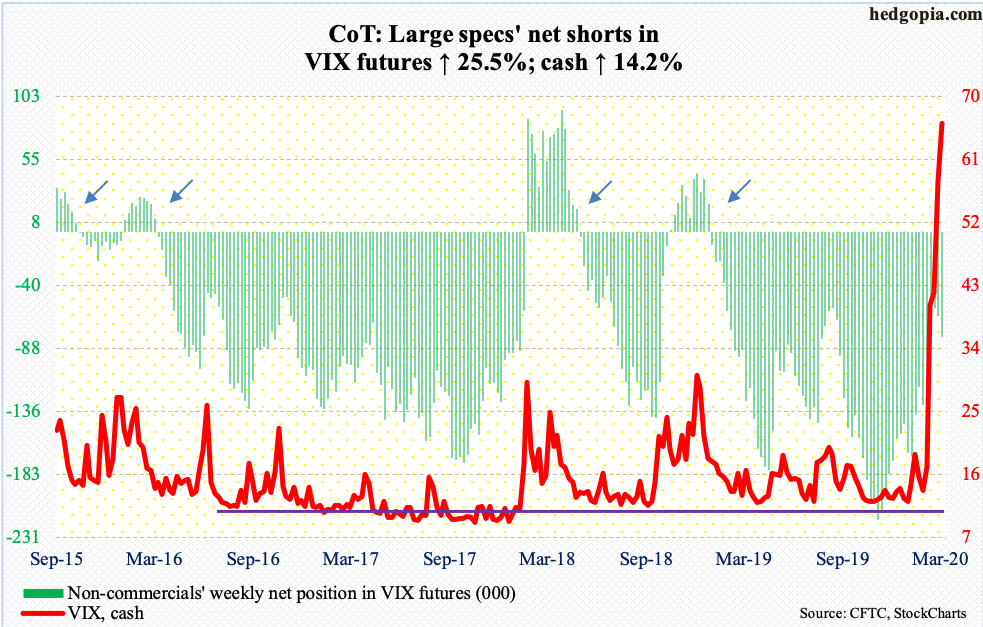
Wednesday’s intraday high of 85.47 was the highest since October 2008 when the cash (66.04) retreated after printing 89.53. This surge in volatility has been like no other. On an intraday basis, VIX was under 12 in January and just over 13 in February.
This week, the volatility index struggled in the low-80s. Of note, after persistently remaining above 70, the daily RSI dropped below that threshold early this week. This is an opportunity for volatility bears. Friday, VIX lost six points even as stocks once again were slammed.


