
AMZN, AAPL, GOOGL And FB Report Earnings On Thursday – What Should We Expect?
Thursday will be a big day in the Q3/2020 earnings season with the big tech companies Amazon, Apple, Facebook and Alphabet, the parent company of Google, presenting their numbers to market participants.
So, what can we expect and, more interestingly, how will the Nasdaq100 react to the numbers?
The lawsuit against Google could hurt Apple
After having significantly outperformed the SP500 CFD in 2020, Amazon and Apple, being up more than 70% YTD and 50% YTD respectively, will be carefully watched by traders.
Facebook and Alphabet will also be cautiously reviewed after the US Department of Justice filed an antitrust suit against the two companies last week, calling them "monopolies". So far, the stocks respective investors seem to not care a great deal, as both names have gained, despite these suits. As it seems, investors seem to view these lawsuits as a sign that these tech companies will likely emerge even stronger from the difficult post-Corona lockdown environment.
Here are the expected earnings per share:
But, if numbers disappoint on Thursday after the market has closed, given the weight of these four names that, combined, amount to more than 30% in the NQ100 CFD, the US tech sector, especially the Nasdaq100, could see an acceleration of the already bearish move which started on Monday.
Such a disappointment, especially in case of Apple can't be completely ruled out: since Apple pushed back the launch of its new 5G iPhone due to the Corona pandemic, initial sales of it won't be included in fiscal fourth quarter earnings, making it more difficult to deduce expectations for the new smartphone.
In addition, in the earlier mentioned lawsuit against Alphabet/Google, Apple has received up to $12 billion per year in high margin licensing fees from Alphabet for setting Google as the default search option on iPhones.
If the lawsuit now shows that antitrust policies have indeed been violated, Apple could see a significant hit to its upcoming earnings.
That would leave the NQ100 CFD vulnerable to an accelerated move on the downside.
How can you trade NQ100 CFD in this environment?
While the Nasdaq100 remains bullish above the SMA(200) and with a clear sequence of higher highs and lows on the daily time-frame, traders will potentially spot the failed attempt to penetrate the former All-Time highs around 12,470 points, pointing to a forming double top.
While such a double top would only be confirmed if the Nasdaq100 drops below its September lows around 10,670/700 points, it seems possible that traders will see at least another attempt to break 11,000 points, which would then level the path down to 10,670/700 points.
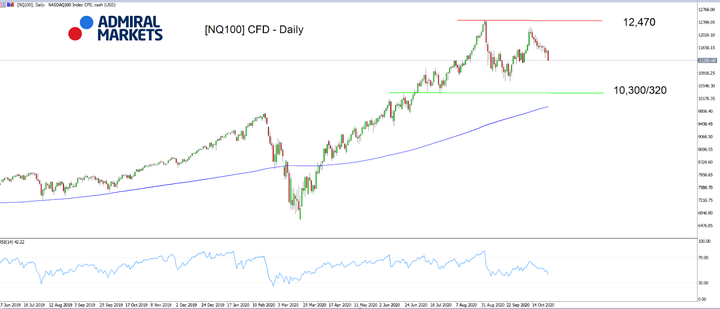
Source: Admiral Markets MT5 with MT5SE Add-on [NQ100] CFD daily chart (from June 27, 2019, to October 28, 2020). Accessed: October 28, 2020, at 10:00 PM GMT. Please note: Past performance is not a reliable indicator of future results, or future performance.
In 2015, the value of the NQ100 CFD increased by 7.8%, in 2016, it increased by 8.4%, in 2017, it increased by 30.5%, in 2018, it fell by 1.6%, and in 2019, it increased by 39.7%, meaning that in five years, it was up by 108.5%.
Disclaimer: The given data provides additional information regarding all analysis, estimates, prognosis, forecasts or other similar assessments or information (hereinafter "Analysis") ...
more

