
Amid Rising Inflation Fears, Parabolic Growth In M2 Money Supply, But Velocity Docile
Massive growth in money supply could potentially lead to inflationary pressures. But the velocity of money is near record lows. As things stand, inflation expectations are perking up near term but remain suppressed further out.
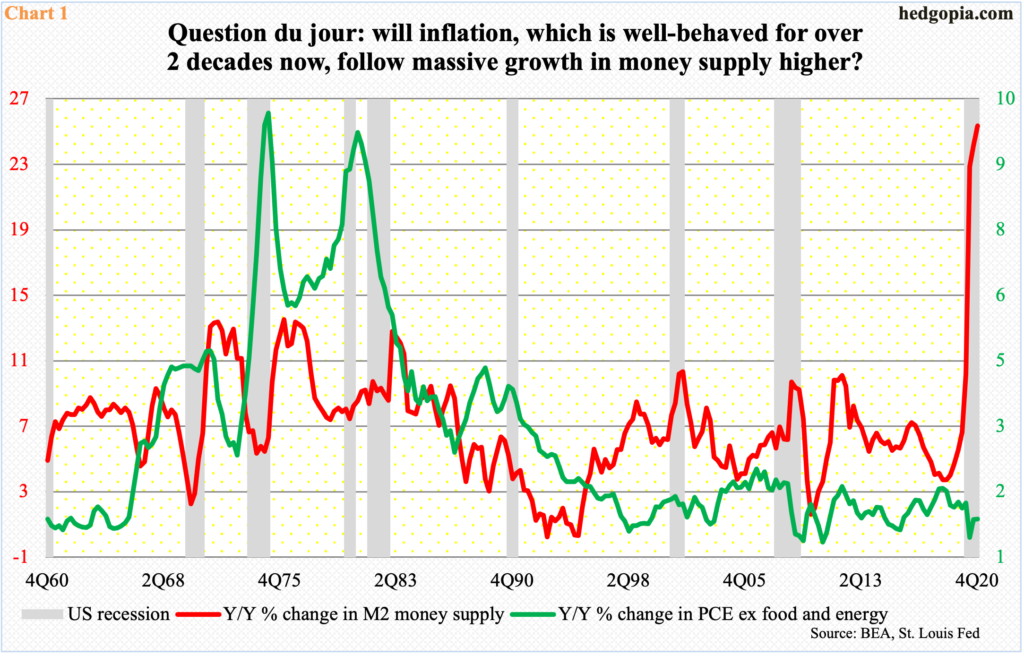
Chart 1 is forcing investors to mull over and ask what if. What if the green line follows the red line higher in due course? They respectively represent year-over-year percent change in core PCE inflation and M2 money supply. The latter has gone vertical.
In 4Q18, money supply grew 3.7 percent from a year ago, before trending higher. A year later, it was growing at a 6.7 percent rate. Then it shifted into a higher gear, surging 25.4 percent last quarter.
Core PCE inflation, which is the Fed’s favorite measure of consumer inflation, rose 1.4 percent in 4Q20. This was the eighth consecutive quarter of sub-two percent inflation. In fact, inflation has remained suppressed for over two decades now.
Hence the question, is this about to change? Will the rapid growth in money supply eventually make its way into the system and push the prices of everything higher?
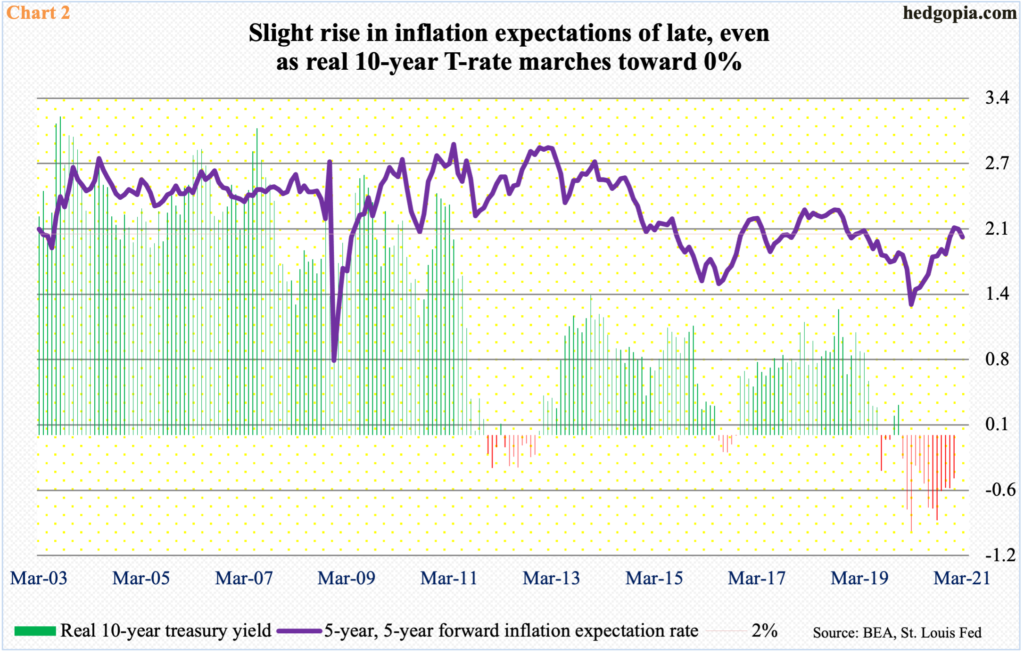
In recent months, there has been an increase in markets’ inflation expectations, but nothing out of the ordinary. The five-year, five-year forward inflation expectation rate remained languished at 1.30 percent last March, before trending slightly higher, hitting a 26-month high of 2.06 percent in January. Currently, it is at 1.97 percent.
Chart 2 also looks at the real 10-year treasury yield, using core PCE to adjust for inflation. February’s inflation numbers are not out yet. At the end of January, the 10-year yielded 1.1 percent, breaking out of one percent early that month. This was then followed by another breakout at 1.2 percent mid-February; by the 25th, rates rose all the way to 1.61 percent, closing out the month at 1.46 percent. On Wednesday (this week), these notes were yielding 1.47 percent.
In the 12 months to January, core PCE inflation rose 1.5 percent. At this pace, the real rate is no longer deeply in the red, and will turn positive in the event the nominal yield continues to push higher.
The ratio of copper (JJC) to gold (GLD) is similarly challenging the highs of June 2018, earlier having dropped to a record low last March (chart not shown here).
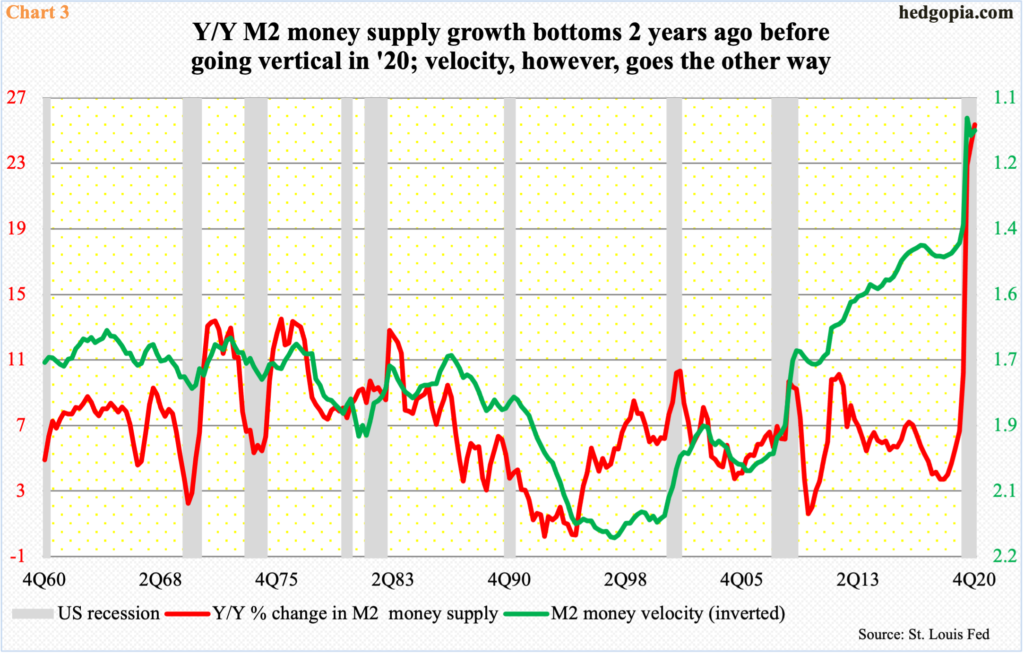
In this context, it is important to remember that growth in money supply has gone through the roof but not the velocity. The latter is shown inverted in Chart 3.
Velocity is a ratio of nominal GDP to money supply and essentially measures the number of times money turns over from one party to another.
Typically, velocity drops during and after economic contraction. Viewed this way, last year’s drop makes sense, as the economy got hit by COVID-19. In 2Q20, a new low of 1.1 was reached, with 4Q at 1.13. What is atypical is that velocity was not able to rise mid-way through last recovery. This is better seen in this chart.
M2 money velocity is a good metric to watch as it can take a pulse of inflationary pressures building in the system.
The other thing is that markets’ inflation expectations are perking up near term but remain muted further out.
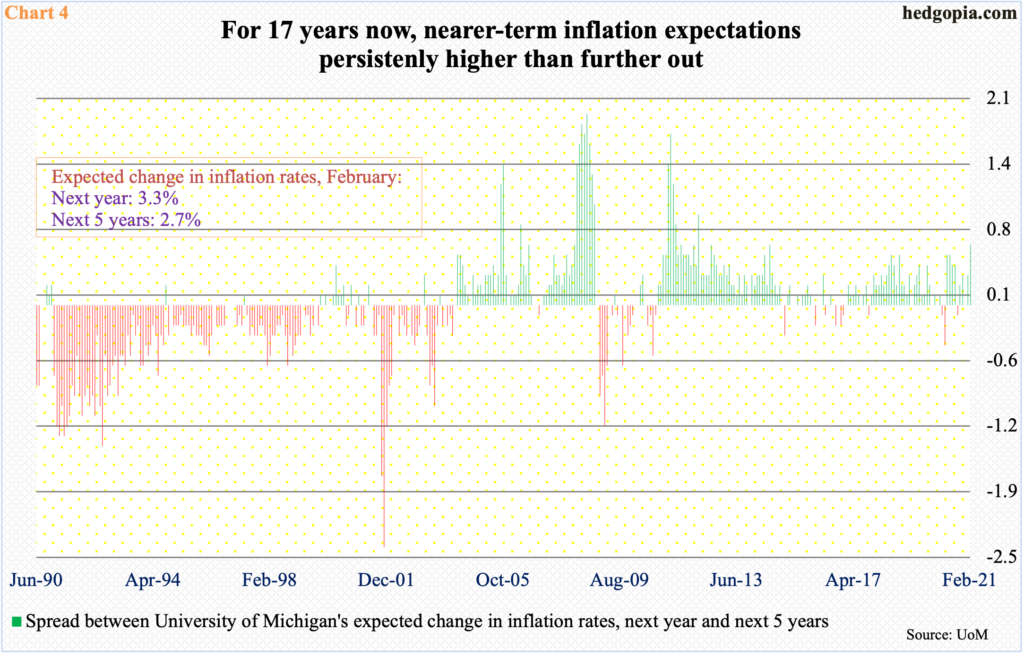
In February, the University of Michigan’s expected change in next year’s inflation rate was 3.3 percent, up from 2.1 percent last April. But for the next five years, this is only 2.7 percent, versus 2.3 percent last March.
Chart 4 in this regard plots a spread between the two timeframes. In February, for example, next year’s exceeded ‘next five years’ by 0.6 points. Barring a few months here and there, with a sea of green, this has persistently been the case for 17 years now. As things stand, markets do not expect this to change. In other words, near-term inflationary pressures are not expected to sustain.
Thanks for reading!


