
AMD: Elliott Wave Structure Calling Another Multi-Year Cycle
Advanced Micro Devices (AMD), a multinational semiconductor company, is following the overall structure of other World Indices. The stock is trading within a corrective sequence within the Grand Supercycle degree. From its all-time low, it rallied and made a major peak early 2000. Which can be also seen in many World Indices. After that, it has been sideways to lower and ended the 3 waves decline in 2015.
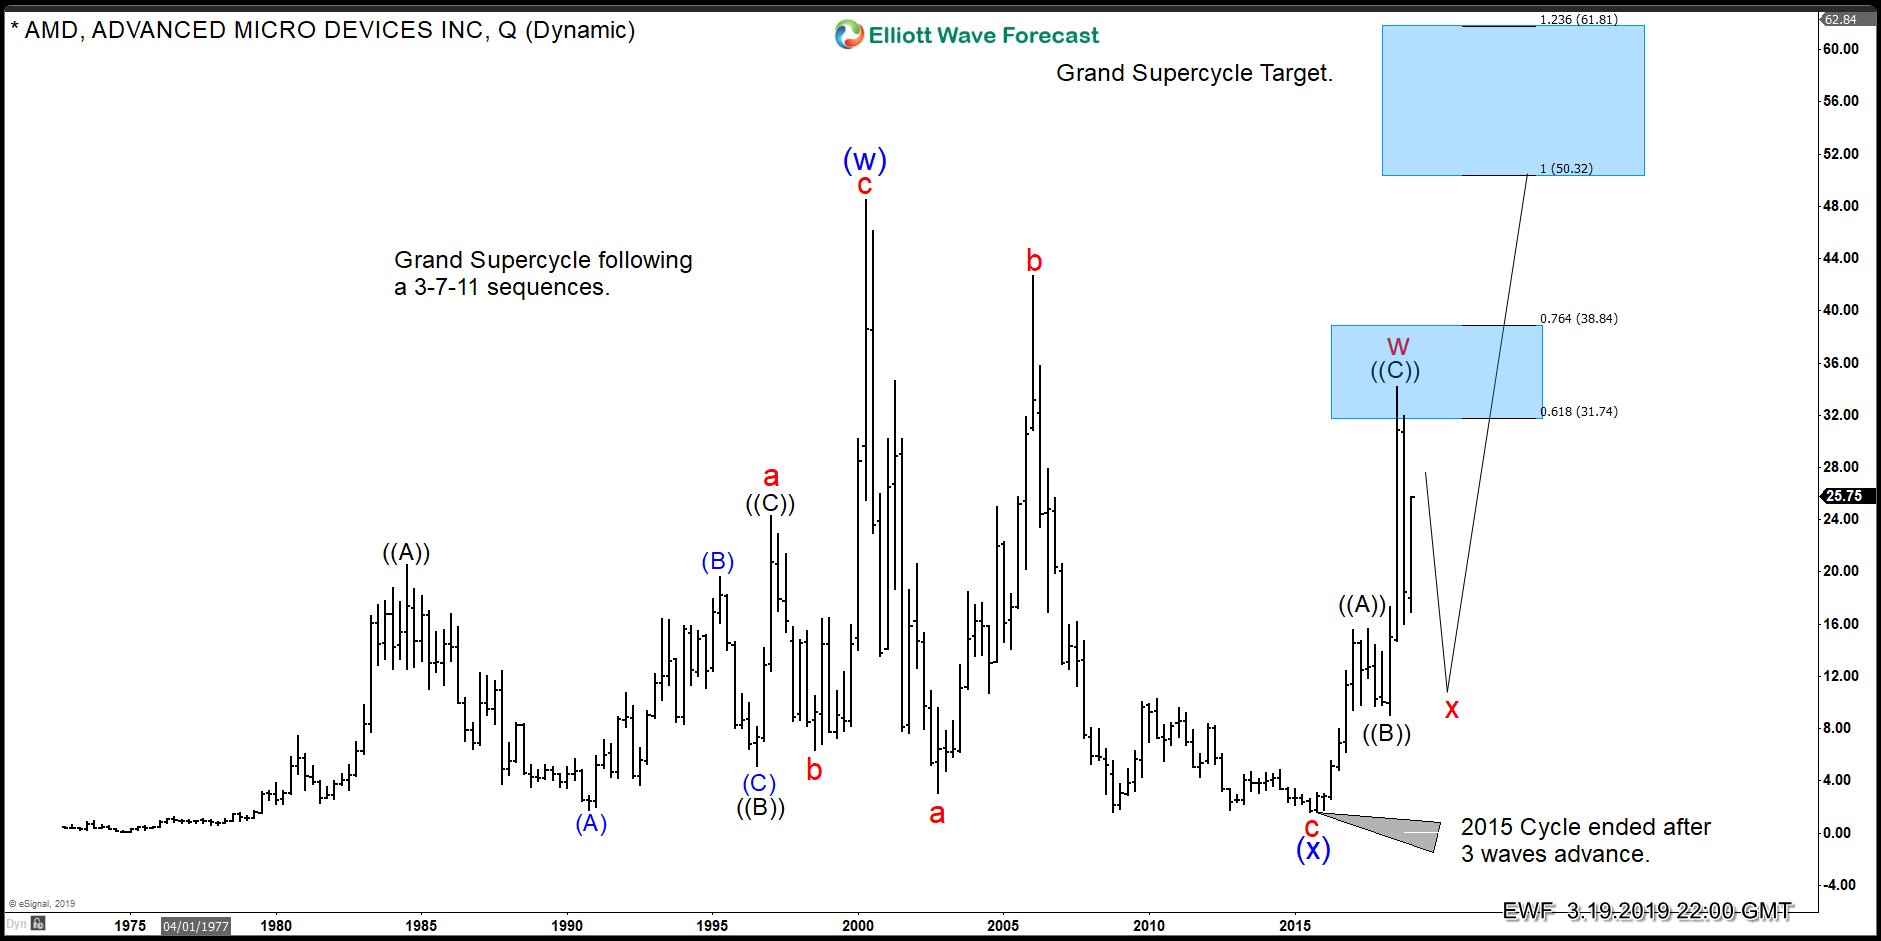
The chart below is representing our view in AMD based on the Elliott wave Theory. We believe that the stock is doing an Eliott Wave Double Three structure within the Grand Supercycle. At this moment, we should be in the 6th swing after that it should resume higher in the 7th swing ideally. Therefore, it can be bought in 3-7-11 swings for more upside as a long-time investment into the Grand Supercycle. The target should be at around $50.12 area.
AMD 03.19.2019 Quarterly Analysis
(Click on image to enlarge)
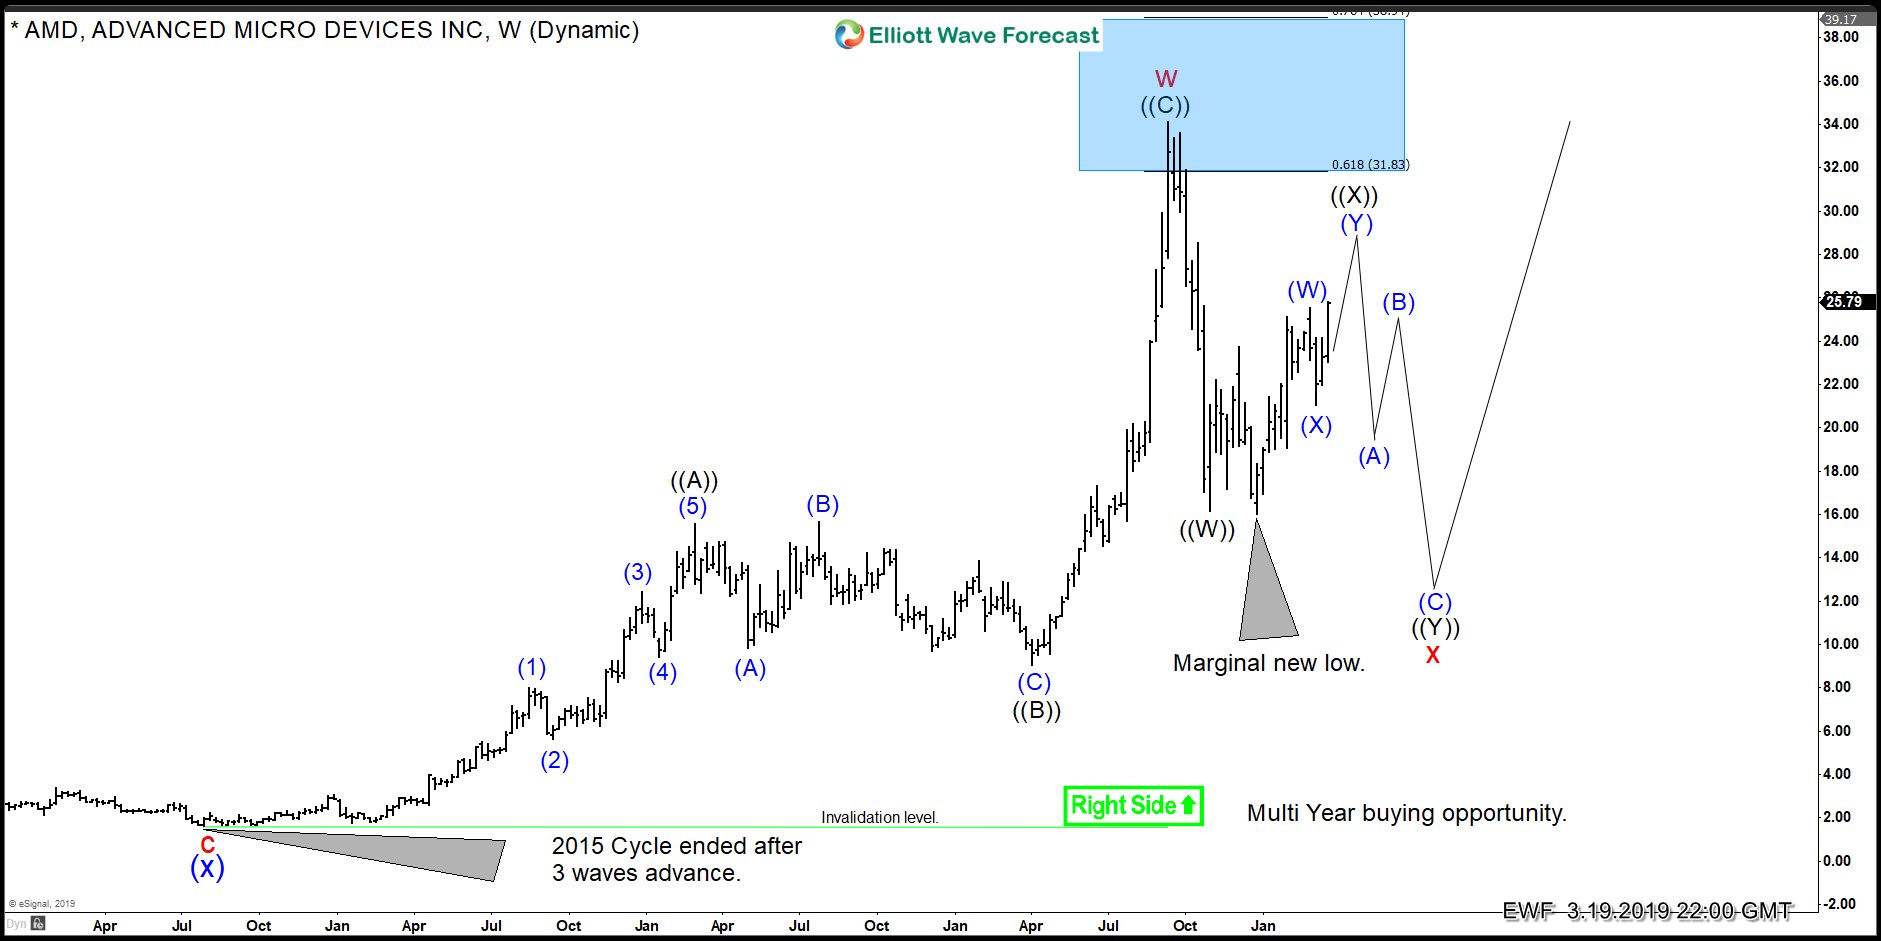
In the weekly chart below you can see that AMD reached the 61.8% area within the Grand Supercycle and peaked at around $34.00 level.Which came within our Blue Box area. That blue box is a very technical area. Where a pullback was expected to take place. Below from 34.00, it did already a 3 waves pullback. But it did a marginal new low at around $16. Which is why the stock can still be doing a connector in ((X)). Before more downside in wave ((Y)) of red X should be seen. Therefore, we do not recommend selling AMD. Rather we recommend buying the dips in AMD in the sequences of 3-7- or 11 swings into the Grand Supercycle target. As the right side is to the upside which you can see below.
AMD 03.19.2019 Weekly Elliott Wave Analysis
(Click on image to enlarge)
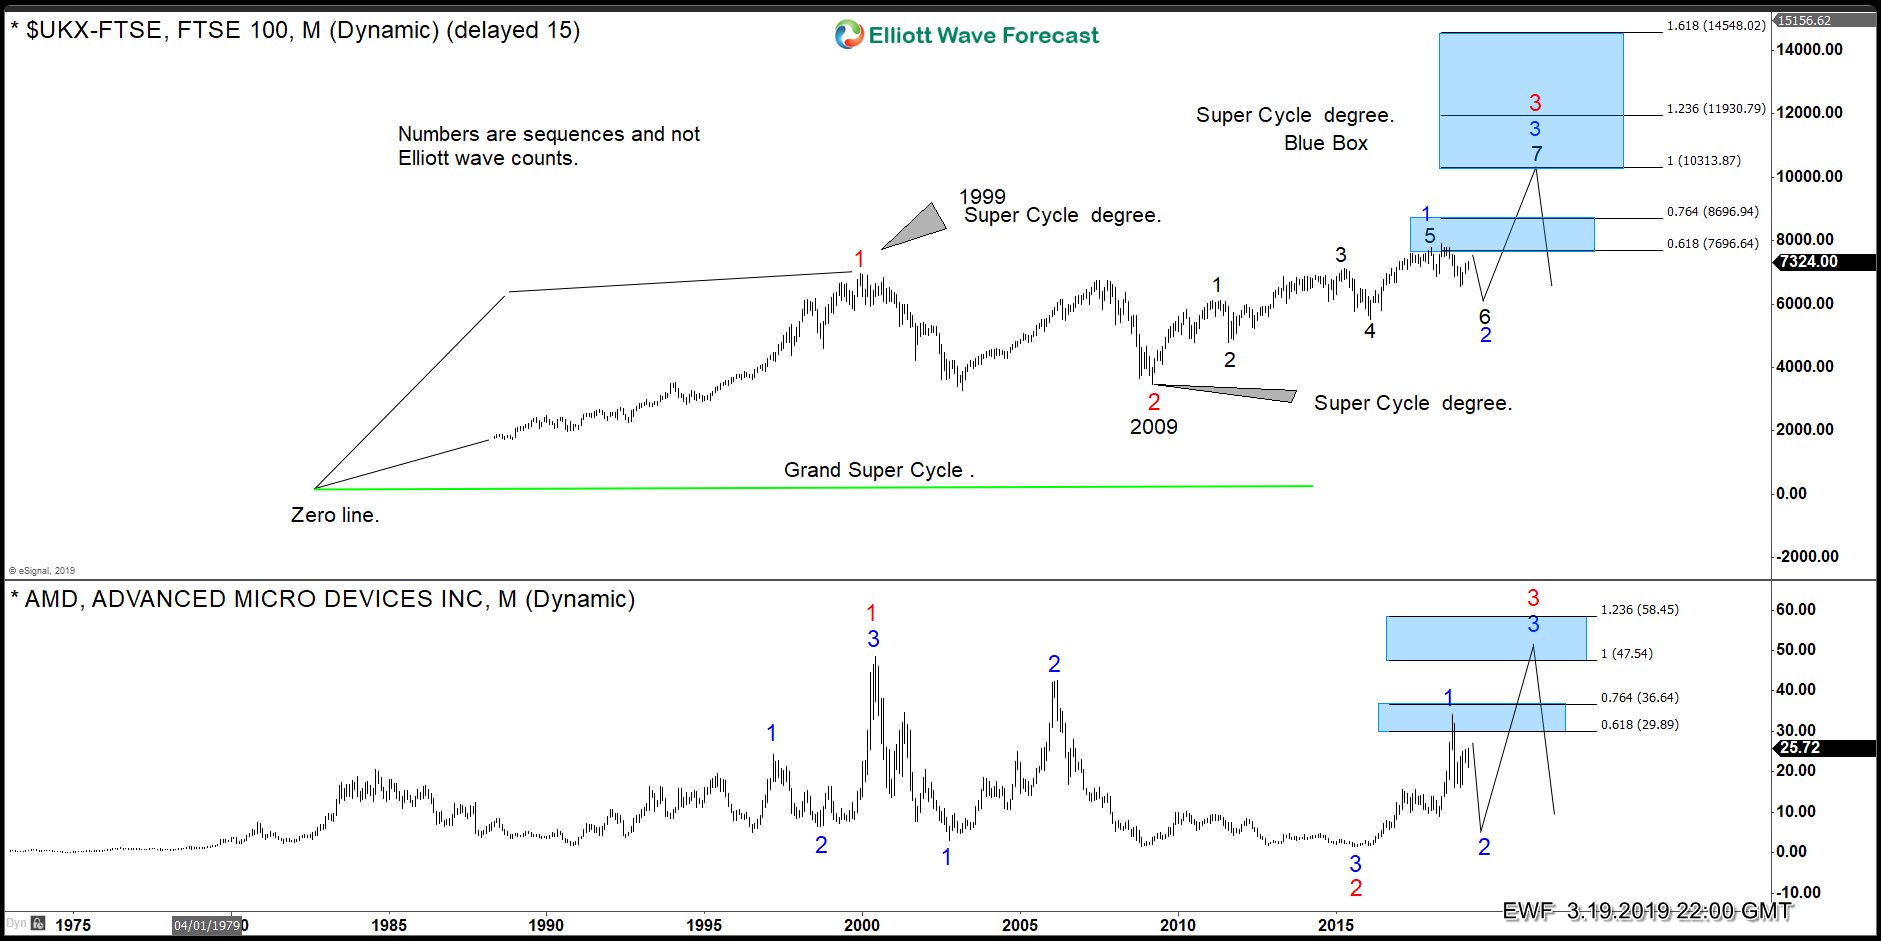
As we have explained above. The Stock is following the main cycles of the World Indices. Now let's take a step further and compare it to the UKX-FTSE monthly chart. As you can see below it is easy to identify the map and the right side based on the FTSE. As the Index has an incomplete sequence to the upside. Which is confirming more upside.
The following charts are highlighting their sequences. We want to explain that the numbers in the charts are not Elliott Wave counts! They are called swing sequences and those are a part of the Market Nature. As we can see both Grand Supercycles are incomplete, and both need ideally another multi-year cycle higher. However, the $UKX-FTSE is confirming the need of another swing higher in Blue into the 10313 area. Which should come at the same time when AMD reach the $50.12 target. So as you can see it is very technical and due to the right side system, it defines the main trend better and easier which results in a possible long term buying opportunity.
FTSE vs AMD Monthly Sequences Analysis
(Click on image to enlarge)
We at Elliottwave-Forecast, have learned to read the Market as a whole and consequently, we are able to provide members with the sequences and Right Side which results in very profitable trading ...
more

