
All Cap Blend Style
The All Cap Blend style ranks third out of the twelve fund styles as detailed in my Style Rankings for ETFs and Mutual Funds report. It gets my Neutral rating, which is based on aggregation of ratings of 48 ETFs and 746 mutual funds in the All Cap Blend style as of July 21, 2014. Prior reports on the best & worst ETFs and mutual funds in every sector and style are here.
Figures 1 and 2 show the five best and worst-rated ETFs and mutual funds in the style. Not all All Cap Blend style ETFs and mutual funds are created the same. The number of holdings varies widely (from 11 to 3661). This variation creates drastically different investment implications and, therefore, ratings. The best ETFs and mutual funds allocate more value to Attractive-or-better-rated stocks than the worst, which allocate too much value to Neutral-or-worse-rated stocks.
To identify the best and avoid the worst ETFs and mutual funds within the All Cap Blend sector, investors need a predictive rating based on (1) the stocks ratings of the holdings, (2) the all-in expenses of each ETF and mutual fund, and (3) the fund’s rank compared to all other ETFs and mutual funds. As a result, only the cheapest funds with the best holdings receive Attractive or better ratings. Investors need not rely on backward-looking ratings. My fund rating methodology is detailed here.
Investors seeking exposure to the All Cap Blend style should buy one of the Attractive-or-better rated ETFs or mutual funds from Figures 1 and 2.
Get my ratings on all ETFs and mutual funds in this style by searching for All Cap Blend on my mutual fund and ETF screener.
Figure 1: ETFs with the Best & Worst Ratings – Top 5
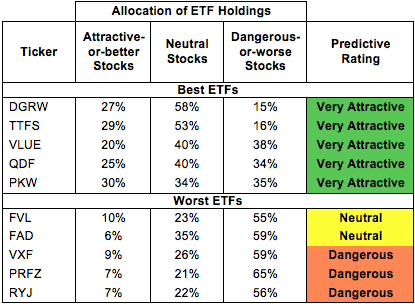
* Best ETFs exclude ETFs with TNAs less than $100 million for inadequate liquidity.
Sources: New Constructs, LLC and company filings
WisdomTree Total Earnings Fund ETF (EXT) and FlexShares Quality Dividend Defensive (QDEF) are excluded from Figure 1 because their total net assets (TNA) are below $100 million and do not meet our liquidity minimums.
Figure 2: Mutual Funds with the Best & Worst Ratings – Top 5
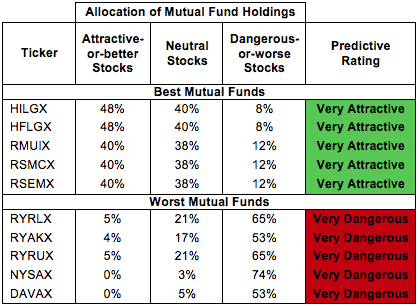
* Best mutual funds exclude funds with TNAs less than $100 million for inadequate liquidity.
Sources: New Constructs, LLC and company filings
Seven funds are excluded from Figure 2 because their total net assets (TNA) are below $100 million and do not meet our liquidity minimums.
WisdomTree US Dividend Growth (DGRW) is my top-rated All Cap Blend ETF and Hennessy Funds Trust: Hennessy Cornerstone Large Growth Fund (HILGX) is my top-rated All Cap Blend mutual fund. Both earn my Very Attractive rating.
Guggenheim Raymond James SB-1 Equity ETF (RYJ) is my worst-rated All Cap Blend ETF and Northern Lights Fund Trust III: Footprints Discover Value Fund (DAVAX) is my worst-rated All Cap Blend mutual fund. RYJ earns my Dangerous rating and DAVAX earns my Very Dangerous rating.
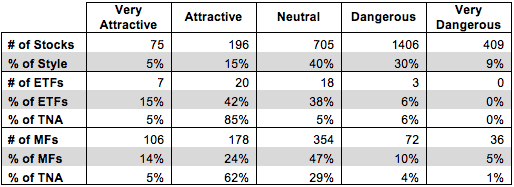
Figure 3 shows that 271 out of the 2791 stocks (over 20% of the market value) in All Cap Blend ETFs and mutual funds get an Attractive-or-better rating. However, 27 out of 48 All Cap Blend ETFs (90% of total net assets) and 284 out of 746 All Cap Blend mutual funds (67% of total net assets) get an Attractive-or-better rating.
Figure 3: All Cap Blend Style Landscape For ETFs, Mutual Funds & Stocks
Sources: New Constructs, LLC and company filings
As detailed in “Cheap Funds Dupe Investors”, the fund industry offers many cheap funds but very few funds with high-quality stocks, or with what I call good portfolio management.
Investors need to tread carefully when considering All Cap Blend ETFs and mutual funds, as the Dangerous-or-worse funds greatly outnumber the Attractive-or-better funds. Only 27 ETFs and 284 mutual funds in the All Cap Blend style allocate enough value to Attractive-or-better-rated stocks to earn an Attractive rating.
Oracle Corporation (ORCL) is one of my favorite stocks held by PKW and earns my Attractive rating. Since 2007, ORCL has grown after-tax profit (NOPAT) by 15% compounded annually. ORCL currently earns a 31% return on invested capital (ROIC), which is high enough to place it in the top quintile of all companies I cover. ORCL has also generated positive economic earnings in every year of my model, which starts in 1998. Despite this impressive growth, ORCL remains undervalued. At its current price of ~$40/share, ORCL has a price to economic book value (PEBV) ratio of 1.2 This ratio implies the market expects ORCL to grow NOPAT by no more than 20% over the remaining life of the corporation. ORCL has more than proven its ability to grow NOPAT at impressive rates and should easily surpass this low expectation.
Sigma Designs (SIGM) is one of my least favorite stocks held by All Cap Blend ETFs and mutual funds and earns my Dangerous rating. SIGM’s NOPAT has been negative for the past three years, and its revenue has continued to decline sharply in the first quarter of 2014. Asset write-downs have rapidly increased and currently stand at 78% of net assets, a sign that management is destroying significant shareholder value. In order to justify its current valuation of ~$5/share, SIGM must achieve positive margins this year and grow revenue by 7% compounded annually for 23 years. It seems that a significant turnaround is already priced into the stock. There is too much risk and too little potential reward in this stock.
Figures 4 and 5 show the rating landscape of all All Cap Blend ETFs and mutual funds.
My Style Rankings for ETFs and Mutual Funds report ranks all styles and highlights those that offer the best investments.
Figure 4: Separating the Best ETFs From the Worst Funds
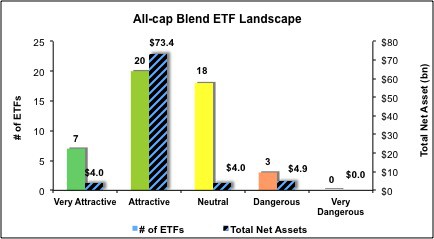
Sources: New Constructs, LLC and company filings
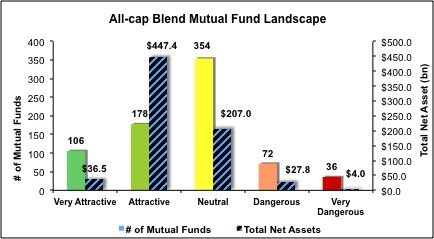
Figure 5: Separating the Best Mutual Funds From the Worst Funds
Sources: New Constructs, LLC and company filings
Review my full list of ratings and rankings along with reports on all 48 ETFs and 746 mutual funds in the All Cap Blend style.
Disclosure: NewConstructs staff receive no compensation to write about any specific stock, sector, or theme.


