
Ahead Of 1Q21 Earnings, Investor Sentiment Lopsidedly Bullish – Unwinding Now Or In A Couple Of Weeks?
This week begins the 1Q21 earnings season. The S&P 500 rallied to a new high last Friday. Sentiment remains elevated. Unwinding is just a matter of time – whether it begins now or in a couple of weeks.
The 1Q21 earnings season begins in earnest this week. Customarily, banks and brokers will do the honors. JP Morgan (JPM), Wells Fargo (WFC) and Goldman Sachs (GS) will report on Wednesday, Citigroup (C) and Bank of America (BAC) on Thursday, and Morgan Stanley (MS) on Friday.
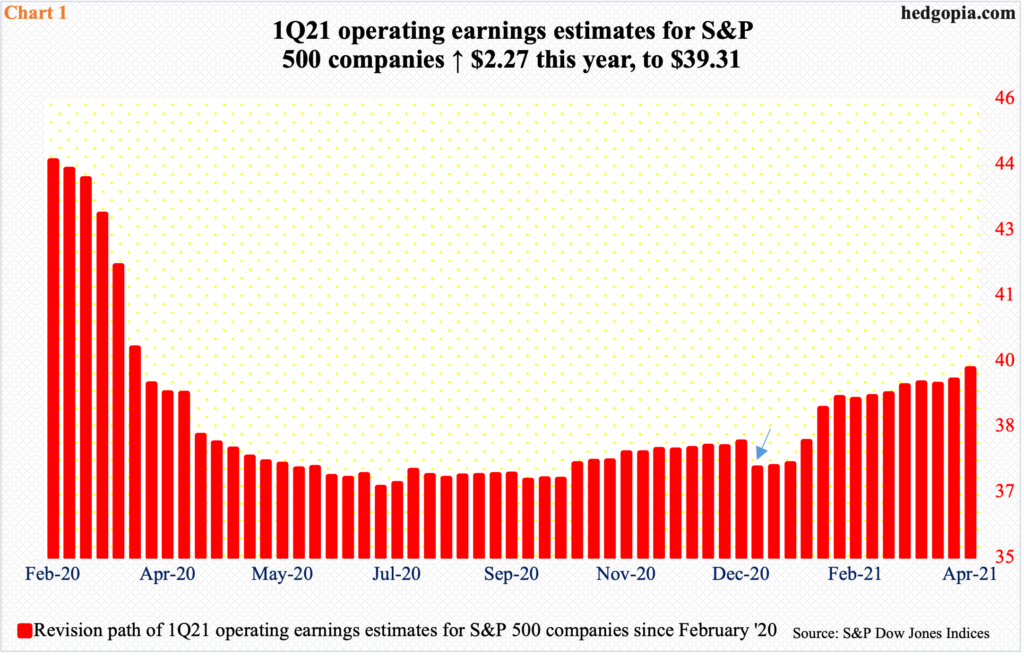
Ahead of this, S&P 500 companies are expected to earn $39.31 in operating earnings in the quarter. This was as of last Thursday. Estimates have steadily gone up this year, with the sell-side expecting $37.04 at the end of last year (arrow in Chart 1).
The revision trend progressively improved throughout the quarter, although estimates were as high as $44.78 in January last year. Back then, these analysts were expecting $194.23 for the whole year. Then Covid-19 hit and the bottom fell out. By mid-July, this year’s estimates dropped to $160.89, before gradually rising to the latest $173.71.
As the aforementioned companies get ready to report this week, XLF (SPDR Financial Sector ETF) posted a new closing high last Friday, as did both the S&P 500 large cap index and the Dow Industrials.
Investor sentiment is beginning to get euphoric.
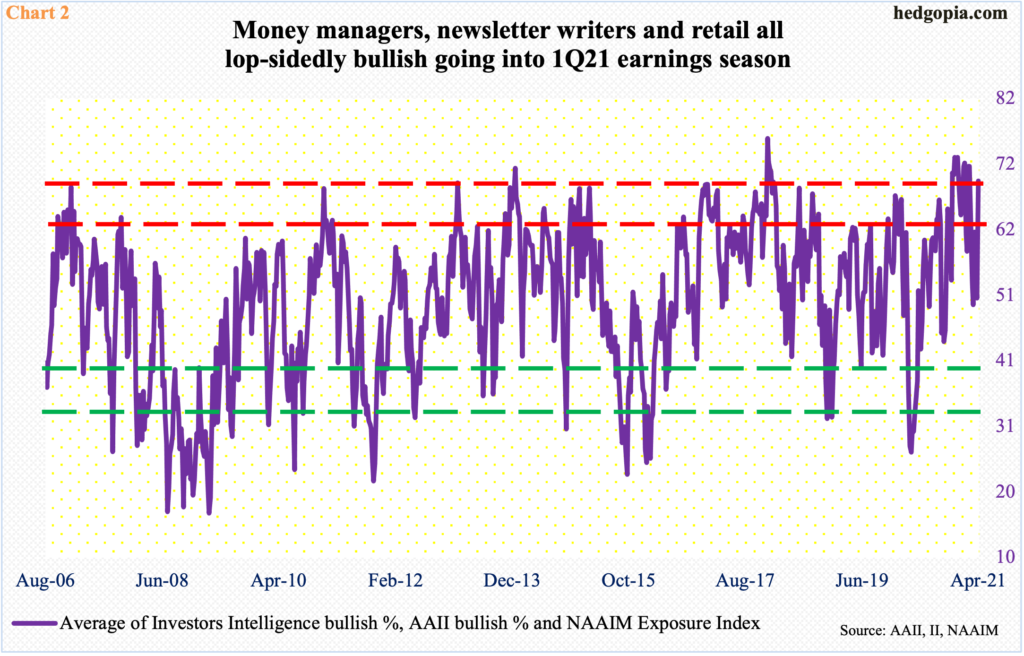
In the week to last Tuesday, Investors Intelligence bulls jumped 6.4 percentage points week-over-week to 60.8 percent – the first 60+ reading in 10 weeks. In the week to Wednesday, the NAAIM (National Association of Active Investment Managers) Exposure Index shot up 37.8 points w/w to 89.9 – a seven-week high. And in the week to Thursday, AAII (American Association of Individual Investors) bulls climbed 11.1 percentage points w/w to 56.9 percent, which was the highest reading since January 2018. The three respectively measure sentiment among money managers, newsletter writers and retail.
In Chart 2, an arithmetic mean is calculated of the three readings. Last week’s total was 69.2, which is very high. Of course, in November-December last year, the reading persistently remained in the low-70s for five weeks straight. That was the time when the US presidential election had just ended and Pfizer (PFE) had just announced its positive vaccine news, followed by Moderna’s (MRNA) similar announcement a week after that.
This time around, earnings – or how investors react to them – will decide if the elevated sentiment begins to unwind or goes sideways.
Arguably, investors are beginning to hide in large-caps. Mid-March, the S&P 500 retreated slightly, before finding support at the 50-day on the 25th. From that intraday low through last Friday, the index rallied 7.1 percent.
Last week, the Nasdaq was up 3.1 percent, but the Nasdaq 100 rallied 3.9 percent. Tech has otherwise been a laggard this year. Year-to-date, the S&P 500 is up 9.9 percent and the Nasdaq 100 7.4 percent. This even after the index’s outperformance month-to-date – up 5.8 percent versus the S&P 500’s 3.9 percent.
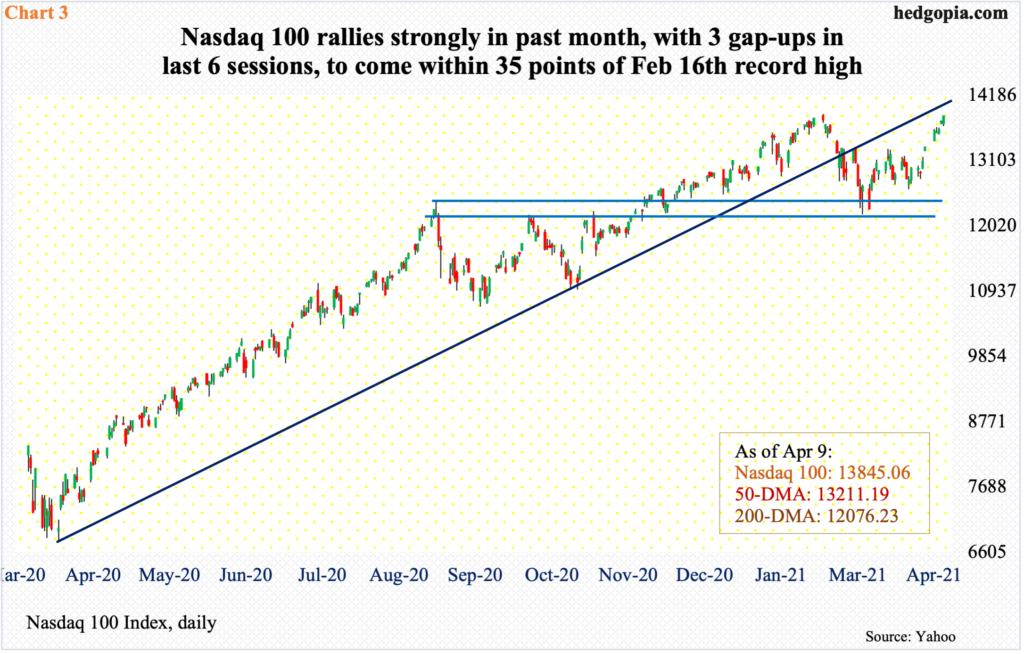
After remaining under the 50-day for a month, the Nasdaq 100 (13845.05) reclaimed the average six sessions ago. Last Friday, it came within 35 points of surpassing its prior high of 13879.77 from February 16 (Chart 3). Ahead of earnings, leading names such as Microsoft (MSFT), Alphabet (GOOG) and Facebook (FB) have broken out to new highs, even as Apple (AAPL) and Amazon (AMZN) are not that far behind. Expectations are high.
In the latter months of last year – post-presidential election and the vaccine news from PFE and MRNA – investors began to gravitate toward small-caps, which inherently have more domestic exposure than their larger-cap brethren. Investors increasingly were pricing in a normal economy sooner than later.
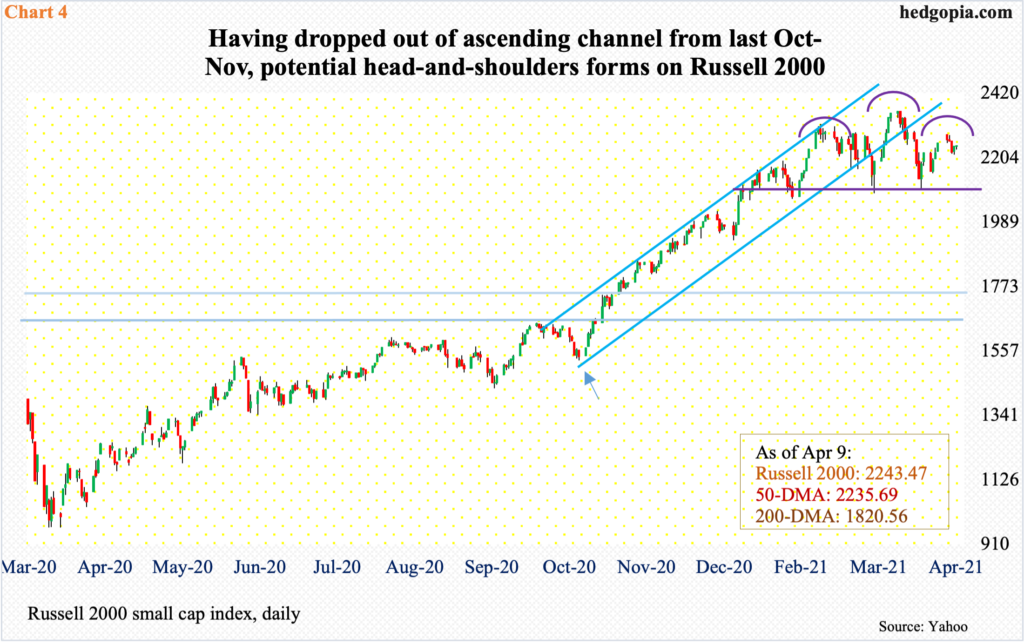
In the growth-to-value shift, tech got hurt and small-caps excelled. From late October-early November, the Russell 2000 traded within a sharply rising ascending channel (arrow in Chart 4). Through its all-time high of 2360.17 reached on March 15, the small cap index (2243.47) surged 144 percent. Then it hit a brick wall.
It is now common knowledge that the US economy is set to boom this year. The Russell 2000 has fallen out of the aforementioned channel. Last week, it lost 0.5 percent, versus up 2.7 percent for the S&P 500 and up 3.9 percent for the Nasdaq 100.
On the daily, the Russell 2000 could be forming a potentially bearish head-and-shoulders top, with the neckline at 2070s-2080s.
Small-caps’ latest action comes in the face of expectations of massive earnings improvement both this year and next.
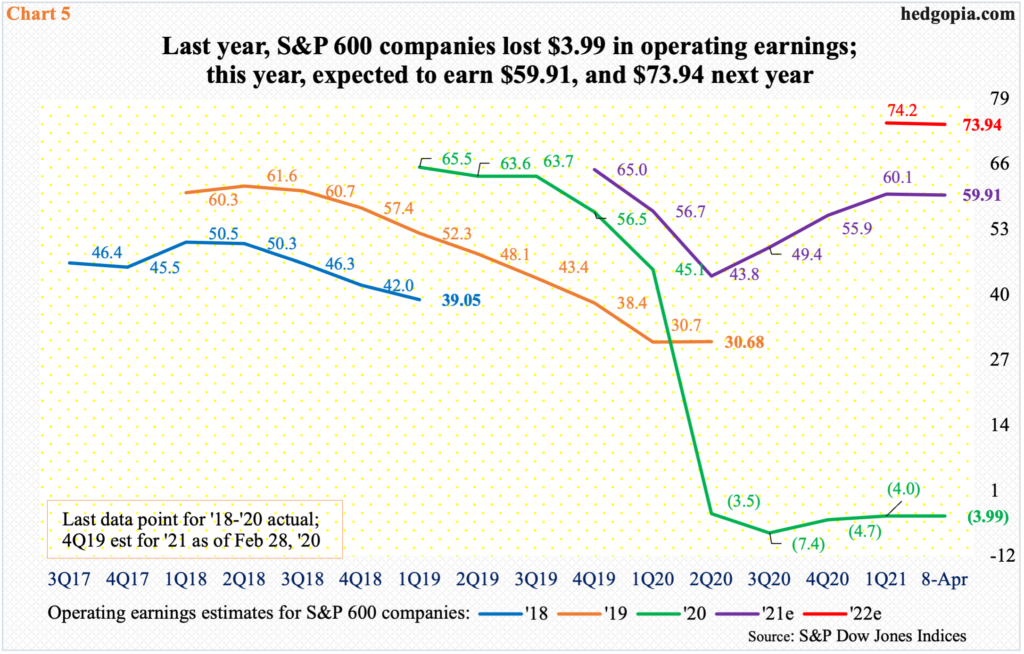
In 2020, S&P 600 companies lost $3.99 in operations; in February 2019, the sell-side expected these companies to earn $67.63. As the pandemic hit, they brought out the knives. Toward the end of last September, they had penciled in a loss of $8.35 for 2020. From this perspective, when all is said and done, a loss of $3.99 is an improvement.
For this year as well, the revision trend bottomed mid-July last year at $42.99, peaking at $61.58 in late February. As of last Thursday, 2021 estimates are $59.91, which, if realized, will be a massive improvement from last year’s. The momentum is expected to continue next year, as earnings are expected to rise another 23.4 percent to $73.94 (Chart 5).
Amidst this optimism, for small-caps to begin to lag is a little foreboding. Estimates for this year have more or less gone sideways the past couple of months. Earlier, small-caps were bought on macro/earnings optimism, which in all probability has crested. At least that is the sense one gets looking at how small- and large-caps are trading.
Because of their relatively small size, small-caps’ underperformance is unlikely to meaningfully hurt the overall market, but will definitely not be sending positive vibes. Large-caps can continue to rally, but without small-caps’ participation, will have done so with a weak foundation.
This is particularly so when considering the rich valuations stocks are commanding at this juncture.
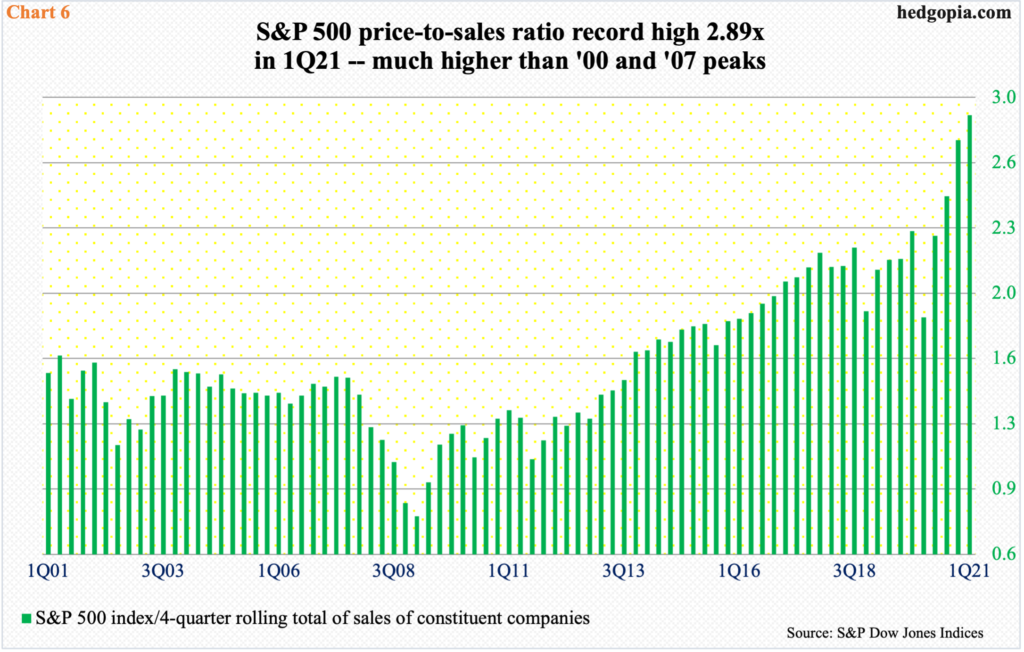
The S&P 500 price-to-sales ratio at the end of March stood at 2.89x – a new record, and up a whole percentage point from a year ago, when the index put in a major low (Chart 6). This is a medium-to long-term worry. Right here and now, earnings will be the main catalyst.
As mentioned earlier, the S&P 500 (4128.80) rallied to a new high last Friday, with decent support at 4080s and 3980s after that, even as the Nasdaq 100 is itching to break out.
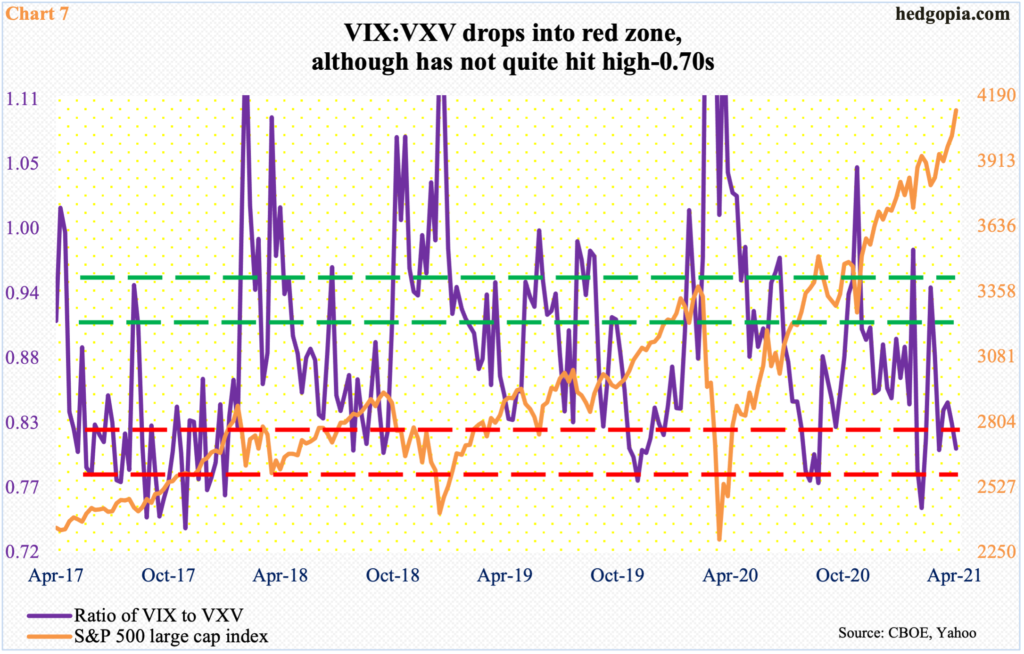
In this scenario, volatility can continue to come under pressure. Having lost 20 eight sessions ago, VIX (16.69), which measures expectations for 30-day volatility using S&P 500 options, ticked 16.20 last Friday. A ratio of VIX to VXV, which does the same as VIX but goes out 90 days, dropped to 0.81. This is low enough the ratio can turn up from here but many a times in the past has gone lower or gone sideways (Chart 7). In either scenario, equities should do well.
Even if things were to pan out this way in the very near term, the ratio is oversold enough it can begin to unwind any time. When that happens, premium for nearer-term volatility – VIX, in this instance – goes up faster, and that in all probability will be bad news for equities. The only question is if this takes place right away or in a couple of weeks as elevated investor sentiment goes sideways at a higher plateau in response to earnings.


Is it possible that those higher prices are built from inflated dollars?? Just asking!
A chemically Induced euphoria will often subside unexpectedly.