
After Posting New Highs, Major US Equity Indices Come Under Pressure Last Week, Landing Right On Important Support

Major US equity indices posted new highs last week, but only to reverse and give back those gains. By Friday, the S&P 500, the Nasdaq 100 and the Russell 2000 were all sitting on channel support. Bulls cannot afford a decisive breach, as it can lead to a self-fulfilling prophecy, given the massive rally from last March and given how lopsidedly bullish several metrics are.
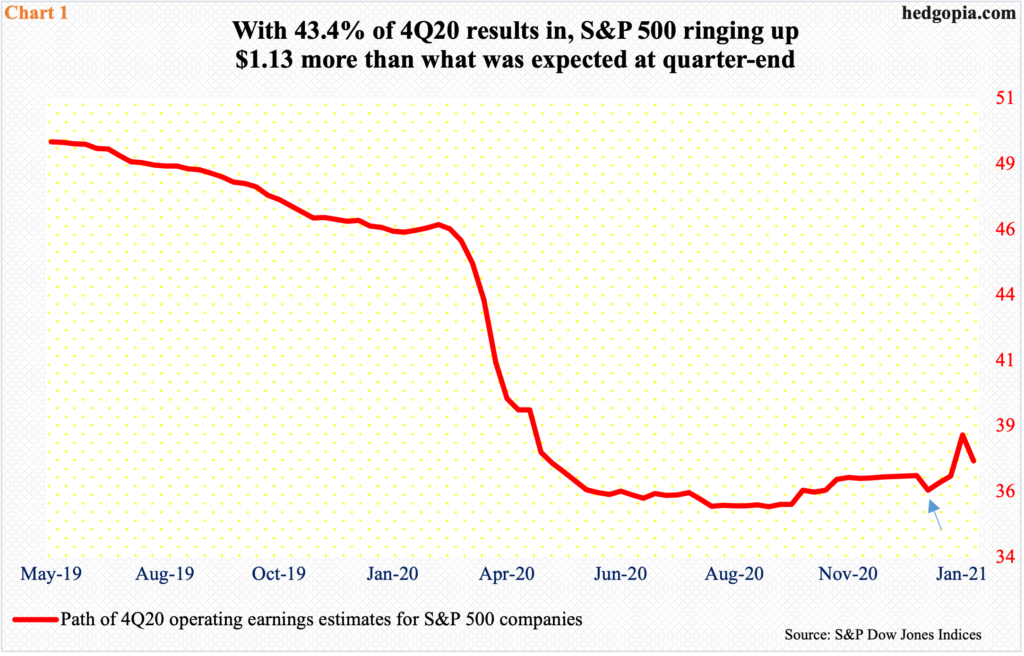
The 4Q20 earnings season is 43.4 percent through. Earnings are coming in better than what was expected at the end of the quarter. But stock reaction has gone the other way.
When 4Q ended, the sell-side expected S&P 500 companies to bring home $36.05 in operating earnings (arrow in Chart 1), having bottomed at $35.43 in late September. As of last Thursday, these companies had rung up $37.18 in blended earnings, although down a full dollar from a week ago.
As a result, 2020 estimates are now $121.37, versus $122.37 a week ago, while 2021 estimates rose from $167.01 to $169.39. If these estimates come through, earnings will have grown a handsome 39.6 percent this year!
Leading up to this, stocks rallied massively. The S&P 500 (SPX) jumped 11.7 percent last quarter. From the low of last March, the large cap index rallied 77 percent.
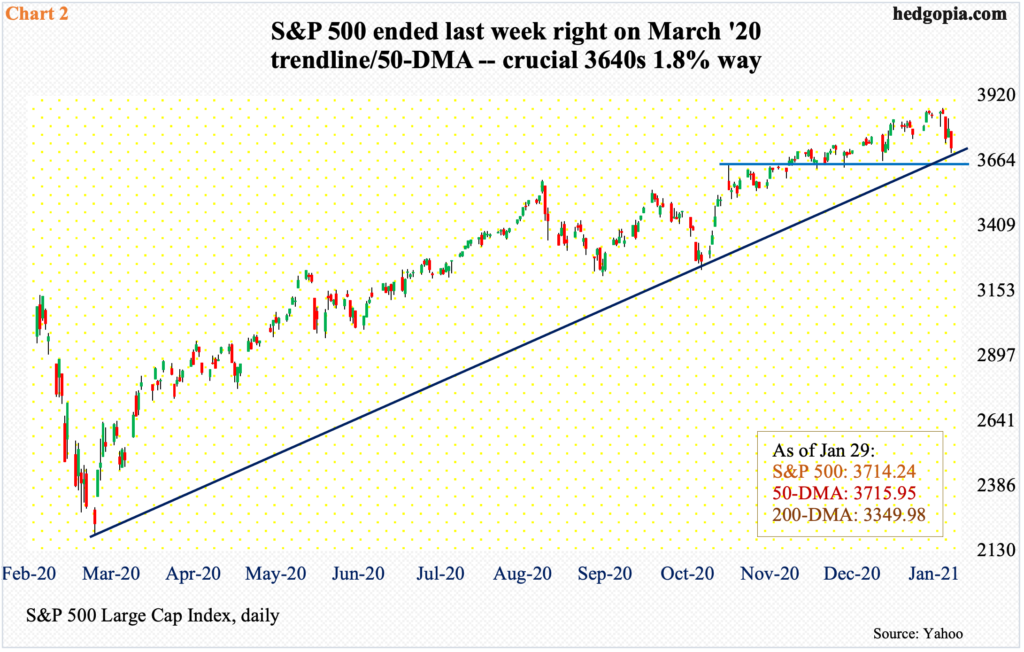
Given the massive move, it is not uncommon to witness weakness on occasion. Last week, the S&P 500 (3714.24) shed 3.3 percent, reversing hard from Tuesday’s fresh intraday high of 3870.90. Although not alarming just yet, a couple of things are worth consideration.
First, the weakness transpired not because earnings are coming in worse than expected rather investors are turning a blind eye to it, which suggests new money is hesitating to buy at this level.
Second, of late there have been subtle signs of fatigue. Last Monday, a hanging man formed, which was preceded by back-to-back dojis. Then came Tuesday’s reversal after posting a new high. By Friday, the index closed right on the 50-day moving average (3715.95), which approximates a rising trend line from last March (Chart 2). If this dual support gives way this week, bulls have an opportunity to put their down at 3640s, which is where the index peaked on November 9 when Pfizer (PFE) announced its positive vaccine news. A loss of this level can quickly result in a test of 3580s; the S&P 500 peaked at 3588.11 on September 2 before correcting over 10 percent in three weeks.
Similar dynamics are at play on the Nasdaq 100 (NDX).
Last week, four of the top six US companies – all tech – reported their December quarter. Except for Microsoft (MSFT), which essentially finished unchanged the day after earnings, Apple (AAPL), Tesla (TSLA) and Facebook (FB) were sold off. Tomorrow, Amazon (AMZN) and Alphabet (GOOGL) report.
Four of the six – AAPL, MSFT, AMZN and GOOG – boast more than $1 trillion in market cap, with AAPL in the $2 trillion club. FB and TSLA are less than a trillion but are over $700 billion. Understandably, they wield tremendous influence on market cap-weighted indices such as the Nasdaq 100 or the S&P 500.
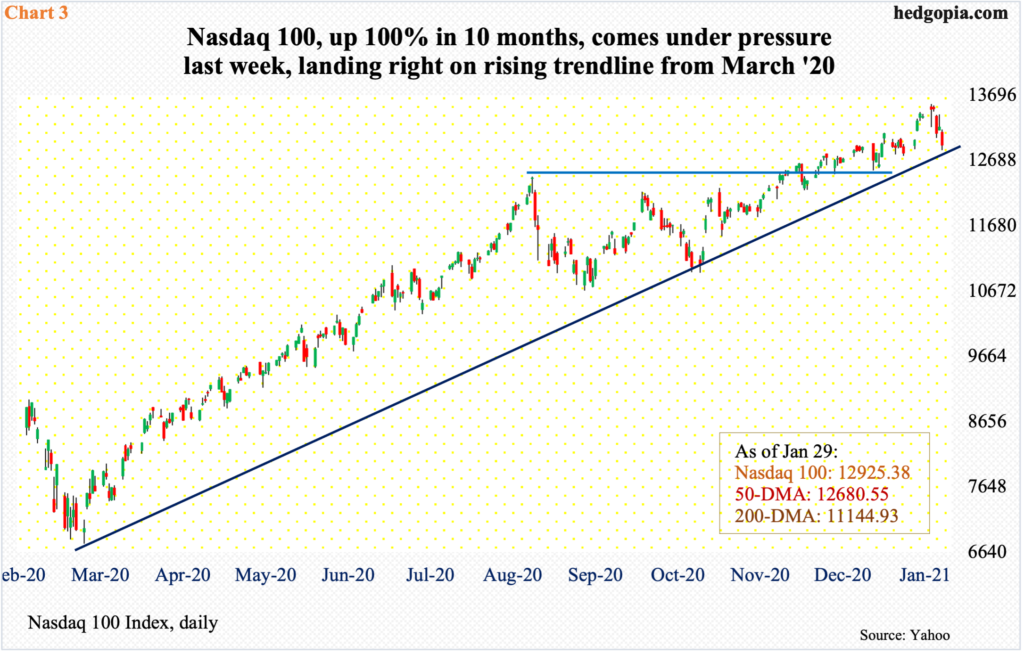
This is why last week’s post-earnings reaction by the leading names can be potentially troubling. The negative reaction follows a massive rally, with the Nasdaq 100 up 100 percent in 10 months. In fact, up until last Monday’s new all-time high of 13563.70, the index (12925.38) was up 5.3 percent for January. Then it reversed. By Friday, January was reduced to a gain of merely 0.3 percent. In the end, the month ended with a long-legged doji, closing last Friday right on trend-line support from last March (Chart 3). It is a must-save.
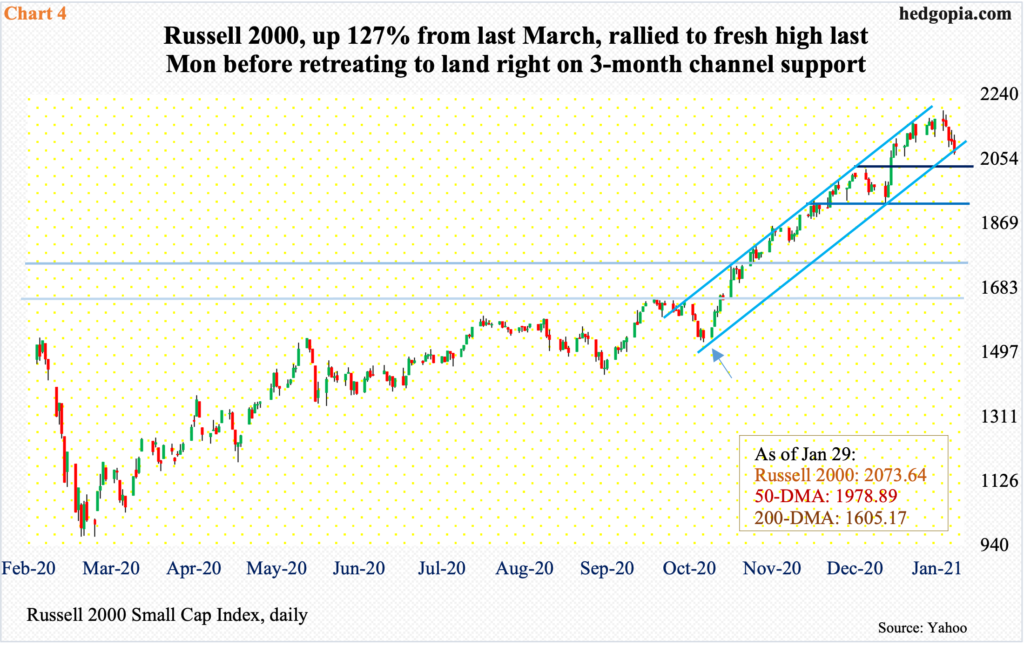
The Russell 2000 (IWM) similarly sits right on a rising channel going back to late October-early November last year (arrow in Chart 4).
Last Monday, the small cap index posted a new intraday high of 2194.86 but was unable to hang on to it, ending the session with a long-legged doji. On IWM (iShares Russell 2000 ETF), in three of the eight sessions through Wednesday, the same pattern formed, with one other being a doji.
This indecisive action precedes a gargantuan rally after bottoming last March. Through the aforementioned high, the Russell 2000 is up 127 percent. A decisive breach of the channel exposes the index (2073.64) to a drop to 2020s, and then 1920s. If things deteriorate further, longer-term horizontal support lies at 1740s, which represents the prior high from August 2018, and 1600-plus, which has proven to be an important level going back to January 2018.
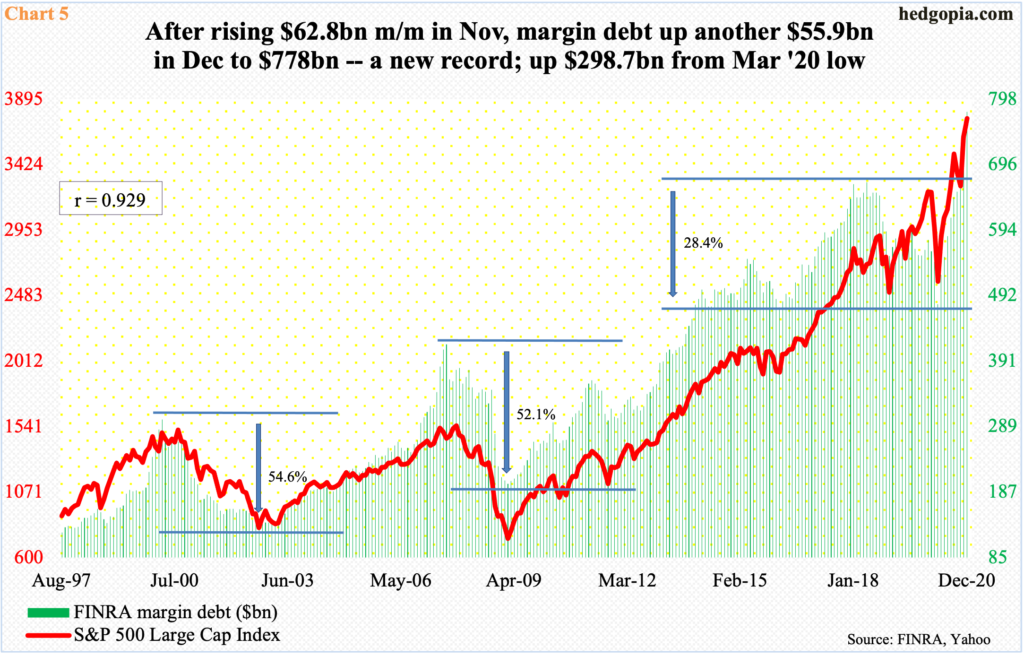
On all these three indices, a loss of the trend line in question can set in motion further weakness as stops likely get taken out. From bulls’ perspective, the longer the weakness persists, the higher the risk that it becomes a self-fulfilling prophecy, as several metrics that are in uncharted territory begin to get unwound. Margin debt, for instance.
In December, FINRA margin debt grew by $55.9 billion to $778 billion – a new record (Chart 5). This follows a $62.8-billion increase in November. In those two months, margin debt jumped 18 percent and the S&P 500 surged 14.9 percent.
From last March, when margin debt bottomed at $479.3 billion, there has been a meaningful increase in investor willingness to take on leverage. Unfortunately, margin debt cuts both ways. It can be fun on the way up but painful on the way down, as margin-call risks rise.
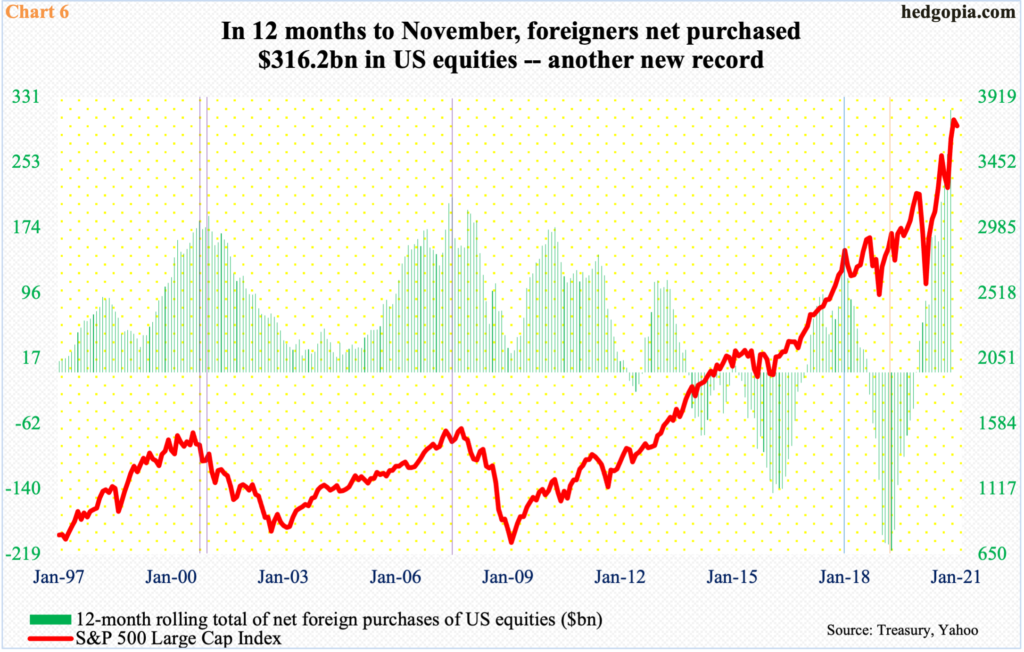
Foreigners are the other risk. They have been aggressively accumulating US stocks and have been dead right on their optimism. On a 12-month basis, up until April 2019, when they sold $214.6 billion worth – a record – they were actively unloading US equities (orange vertical line in Chart 6). Then they turned. In the 12 months to November, they bought $316.2 billion worth – a new record. Even in February and March last year when stocks were in a free fall, they were buying.
Historically, foreigners’ purchases – or a lack thereof – and the S&P 500 track each other pretty well. Particularly of note is how they both turned lower in 2000 and 2007 (violet vertical lines). So, their behavior is obviously worth watching, as they are sitting on tons of paper profit.
Interestingly, leading up to last week’s price action, American Association of Individual Investors bulls had been gradually pulling back their horns. As of last Wednesday, their count was 37.7 percent, down 4.8 percentage points from the prior week. This was a 12-week low. In the week to November 11, they were 55.8 percent.
In contrast to this rather subdued retail sentiment, professionals were exceedingly bullish. Last week, the NAAIM Exposure Index, which represents National Association of Active Investment Managers members’ average exposure to US equity markets, dropped 29.4 points week-over-week to 83.5, but this was from a very elevated level. The prior week’s 112.9 reading was the second highest ever. Going back to July 2006 – encompassing 761 weeks – there have been 27 100-plus readings, seven of which occurred since mid-November, or 11 since mid-August. That is how persistently elevated this metric has been. Last March, amidst the selloff, it bottomed at 10.7.
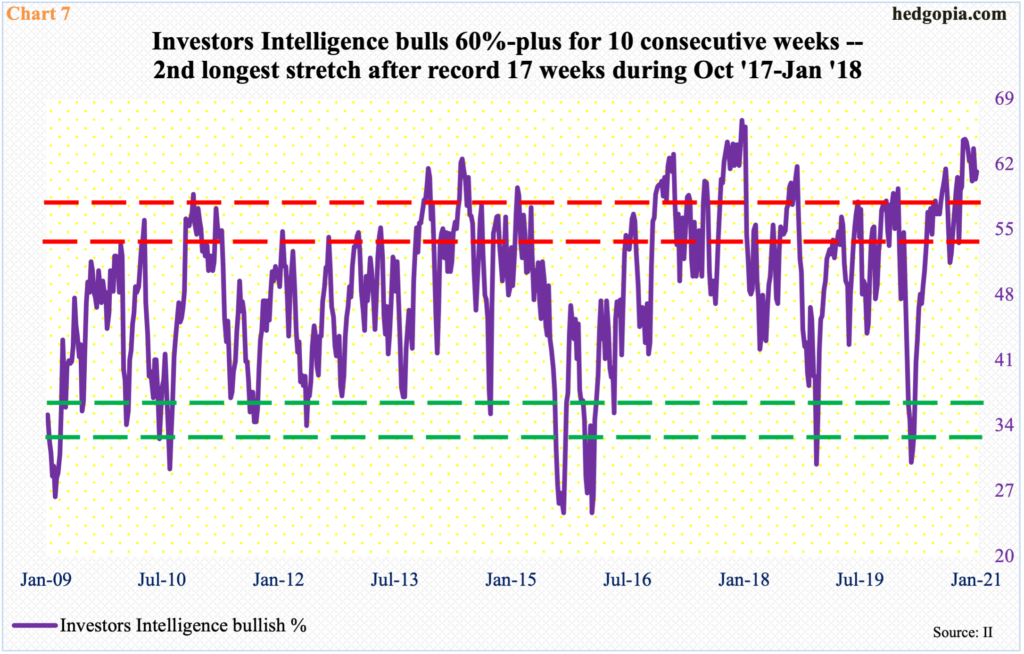
Elsewhere, Investors Intelligence bulls – taking a pulse of newsletter writers’ sentiment – have been 60 percent or higher for 10 straight weeks (Chart 7). Last week, their count rose eight-tenths of a percentage point w/w to 61.2 percent. This is the second longest 60-percent-or-higher stretch after a run of 17 uninterrupted weeks between October 2017 and January 2018.
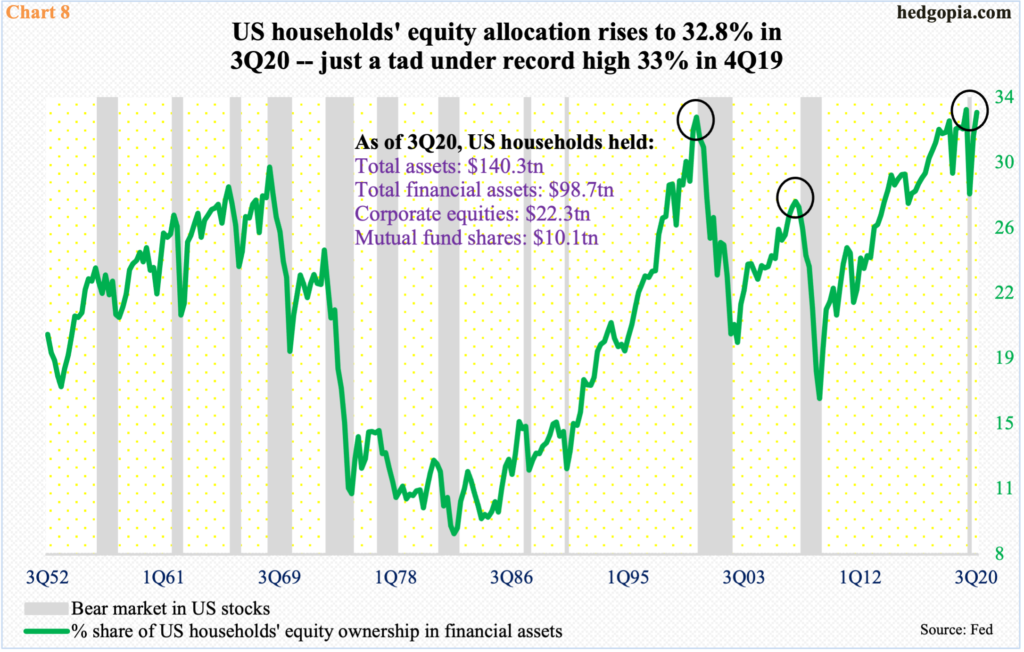
Amidst this elevated optimism, it is probable US households’ equity allocation rose to a new high in the last quarter. As of 3Q, it stood at 32.8 percent, which was only two-tenths of a percentage point lower than the 4Q19 record high (Chart 8). To reiterate, stocks rallied massively in 4Q, with the S&P 500 jumping 11.7 percent.
It is tough to guesstimate how high is too high. The metric is already slightly higher than when it began to unwind in 2000 and much higher than the peak in 2007. Logically, the higher it goes, the more the risk of a painful unwinding. It is equally possible it pushes further into uncharted territory, given investor fascination with the so-called Fed put.
What transpires right here could leave us some clues. The S&P 500 is right on its 50-day, with 3640s 1.8 percent away, while the Nasdaq 100 is 1.9 percent away from the average. It is hard to imagine equity bulls letting go of this average, not to mention the trend-line support, without a fight. If bears prevail, unwinding risks of overbought conditions meaningfully rise – timing and magnitude notwithstanding.
Thanks for reading!


