
After Massive Rally Post-March Lows, Major Equity Indices Falling Under Their Own Weight
The recent selloff in equities has come at a time of elevated Fed balance sheet, stabilizing earnings estimates and improving macro data. Either stocks believe these positives are not lasting or they are falling under their own weight, as they rallied massively from March lows. Several indicators have a ways to go before their overbought conditions are unwound.
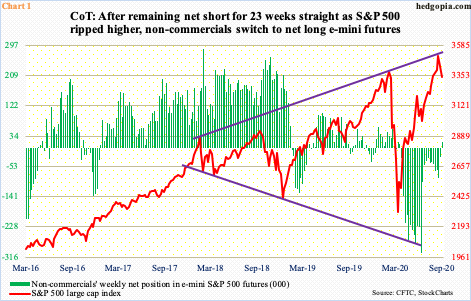
Market squeezes go both ways. In a long squeeze, a decline in price is perpetuated by panic selling by longs. In a short squeeze, shorts are forced to cover, providing further boost to the price. Nowhere was the latter more obvious than e-mini S&P 500 futures the past several months.
After a February-March collapse, the S&P 500 large cap index (3340.97) bottomed on March 23 at 2191.86. By September 2, it tagged 3588.11. The nearly 64 percent surge came in a little less than five and a half months. When the rally got underway, investor mood was somber, with several indicators at washout levels.
Nevertheless, non-commercials, who were net long e-mini futures until the week to March 24, switched to net short in the following week and stayed bearish until last week, for a total of 23 weeks. Throughout this, the S&P 500 ripped higher. (SPX)
Seven sessions ago, the index reversed after rising to the aforementioned record high. Last week, non-commercials switched to net long (Chart 1). (Their holdings are as of last Tuesday.) In essence, what this could mean is that the short-squeeze fuel that provided such a strong tailwind to the rally is spent up. Now, bulls will have to do the heavy lifting themselves.
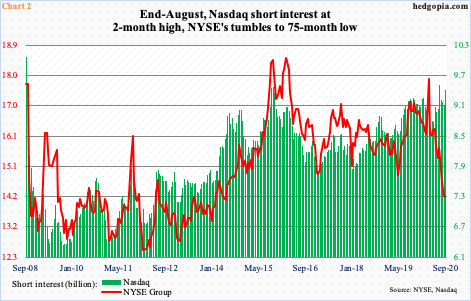
On the NYSE, a similar phenomenon is in play. By the middle of March, short interest stood at a four-year high 17.9 billion shares. As stocks rallied, shorts began to turn tail. By the end of August, short interest had dropped to 14.2 billion – a 75-month low (Chart 2). Once again, zealous shorts lent a big helping hand to the 53.5 percent rally in the index. (NYA)
That said, these dynamics are a little different on the Nasdaq. At the end of June, short interest stood at 9.5 billion, which was the highest since mid-September 2008. The index was just getting ready for another leg higher. Shorts beat a hasty retreat. In the next month and a half, short interest declined 4.2 percent to 9.1 billion. In the next period – that is, by the end of August – shorts again got active, raising short interest to 9.4 billion, which is not that far away from the end-June high. They have been rewarded this time. The Nasdaq peaked on September 2 and is down just a tad over 10 percent.
Several times in the past, aggressive shorts in due course have ended up helping longs as they cover. Time will tell if the latest buildup in short interest ends up similarly, although immediately ahead shorts carry better odds.
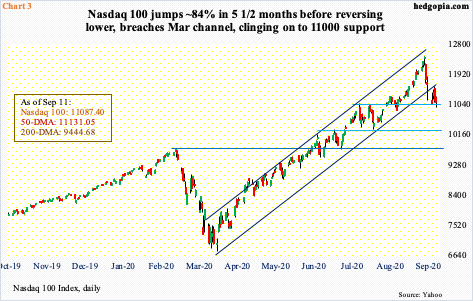
From their perspective, the Nasdaq, or the Nasdaq 100, have breached crucial trend-line support from their March lows. In fact, Thursday’s intraday high of 11566.34 on the Nasdaq 100 was rejected at the underside of that broken line (Chart 3). (NDX)
Tech bulls tried to put foot down last Wednesday when they rallied the index three percent. This preceded a three-session, 11.1-percent tumble, landing right on the 50-day moving average (11131.05). Come Thursday, the average was tested again as intraday rally attempts petered out. Friday, the average was breached, albeit slightly.
The index (11087.40) is now below both the 10- and 20-day. Last Thursday’s intraday high also retreated from just under the 20-day. A 10/20 cross-down seems imminent. Once 11000 gives way, next area of support lies at 10300-10400.
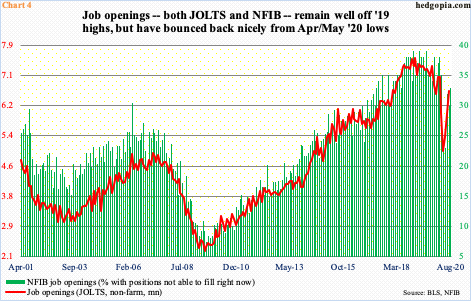
Rather interestingly, equities have begun to come under pressure without any visible catalysts. In fact, after massive disruptions in the early months this year, macro data are on the mend, some substantially. July retail sales, for instance, were up 29.9 percent from April’s low to a seasonally adjusted annual rate of $536 billion – a new record. (August’s numbers are due out Wednesday.) Several other series have not quite risen to new highs but have seen significant improvement off the lows early this year. Job openings – both non-farm (JOLTS) and NFIB – for example.
Non-farm job openings increased 617,000 month-over-month in July to 6.6 million. In April, openings were down to five million. The record high of 7.5 million was set in January last year. The NFIB job openings sub-index, similarly, hit 39 three times between December 2018 and July 2019. In May this year, this tumbled to 23, before rising to 33 last month (Chart 4).
Equities are also selling off even though there has been no change in the Fed’s ultra-dovish language. The central bank’s current posture is viewed as an essential backstop for stocks. The day the S&P 500 bottomed on March 23, the Fed began an open-ended QE and also said it would begin buying investment-grade corporate bonds, which on April 9 was extended to also include junk bonds.
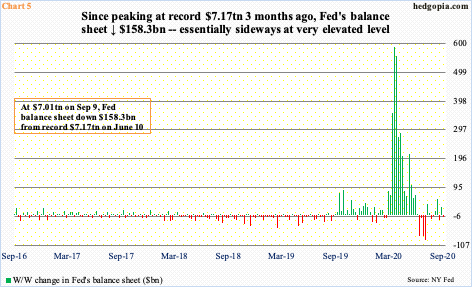
Early March, the Fed held $4.24 trillion, which had already been trending higher since August last year when it held $3.76 trillion. After the March monetary moves, the balance sheet went parabolic. In the next three months, it surged to $7.17 trillion. Since then, assets have dropped by $158.3 billion, with moderation in the week-over-week change (Chart 5), but at $7.01 trillion remain massive. It is too soon for markets to wonder about how the Fed might unwind all this.
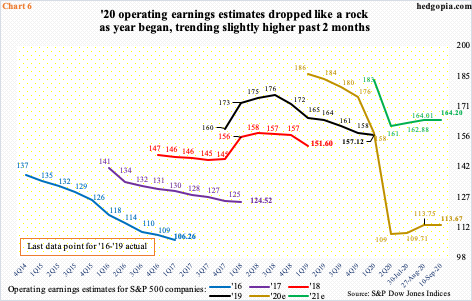
The latest selloff in equities is coming at a time when earnings expectations have at least begun to stabilize. Early in the year, they literally dove off a cliff. At the end of last year, the sell-side expected S&P 500 companies to earn $175.52 in operations this year. By the week to July 8, they had lowered their numbers to $108.86. In the past couple of months, the revision trend has reversed from downward to upward. With two more quarters to go, 2020 is now expected to bring in $113.67 (Chart 6). Estimates for 2021 similarly went from $194.23 in January last year to $160.89 mid-July this year to $164.20 as of last Thursday.
That said, there is sufficient reason for markets not to go gaga over the latest revision trend. The sell-side tends to be an optimistic bunch. In March last year, 2020 estimates were as high as $186.36. Given this, it is hard to take 2021 numbers in particular at face value.
In all probability, equities have begun to fall under their own weight. Tech clearly led from the March low, with the Nasdaq 100 soaring nearly 84 percent. The tech march was led by the generals, with soldiers falling behind. The percent of Nasdaq 100 stocks above the 50-day peaked as far back as early June at 98 percent, even as the index continued higher. Last Friday, this dropped to 39 percent. In the past, the generals in due course have shown a tendency to follow the soldiers lower.
The risk facing the bulls is further technical deterioration, leading to a long squeeze. Major equity indices, which remain overbought on both the weekly and monthly, are essentially sitting on their 50-day. Some like the Nasdaq 100 and the Russell 2000 have even breached the average, albeit slightly. (IWM)
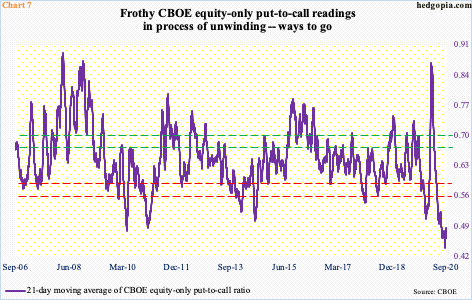
A decisive break of the average can set in motion a process of unwinding elsewhere. One such metric is the 21-day moving average of the CBOE equity-only put-to-call ratio, which went from 0.867 (extreme fear) on March 20 to 0.439 (extreme greed) on September 2. Last Friday, the ratio closed at 0.486 (Chart 7). Once unwinding is set in motion, there is a long way to go before the prevailing froth is taken care of.
Thanks for reading!


