
After Massive Rally Off March Lows And Options Waiving Caution Flag, Johnny-Come-Latelies Risk Holding The Bag
Overbought on the daily timeframe, major US equity indices are right at, or near, the upper bound of the recent trading range. Volume has dried up, and bulls are staying put, hoping for a breakout. Should one come about, there is potential for short squeeze and for sentiment to get frothier. After that, risk-reward odds decidedly favor bears.
Off the March lows, major US equity indices have had phenomenal rallies.Action is top-heavy, with large-cap generals well ahead of their smaller-cap soldiers. Both the S&P 500 large cap index (SPX) and the Nasdaq 100 index (NDX) have retraced more than 61.8 percent (golden ratio in Fibonacci lingo) of their February-March decline, while the Russell 2000 small cap index retraced 50 percent of its.
Amidst this feel-good story, volume has dried up, and indices have entered a sideways pattern. At best, they are consolidating their gains, for another leg higher. At worst, they are simply tired.
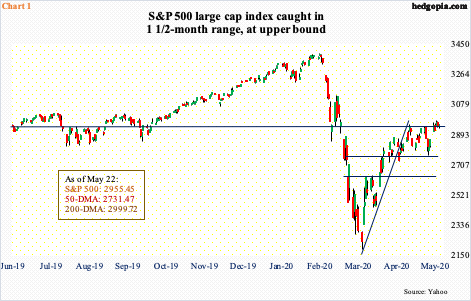
On the S&P 500, the index tagged 2954.86 on April 29. Last week, it closed at 2955.45. In between, it made a low of 2766.64 on May 14, and a high of 2980.29 last Wednesday. That low, at the daily lower Bollinger band, was bought, while the high, at the upper band, was sold. Although the fact remains that the index remains at the upper bound of the recent range (Chart 1). Plus, the 200-day moving average lies right above at 2999.72, not to mention the psychologically important round number 3000.
Bulls obviously are hoping for a breakout and staying put. Should one occur, there are some potential tailwinds.
The S&P 500 bottomed on March 23. From the week ended March 25, through last Wednesday, $38.2 billion left US-based equity funds, including last week’s $4.9 billion (courtesy of Lipper). Similarly, from March 23 to May 20, SPY (SPDR S&P 500 ETF), VOO (Vanguard S&P 500 ETF) and IVV (iShares Core S&P 500 ETF) collectively lost $13.3 billion, including $4.6 billion in the week through last Wednesday. In other words, the rally is being used as an opportunity to lighten up.
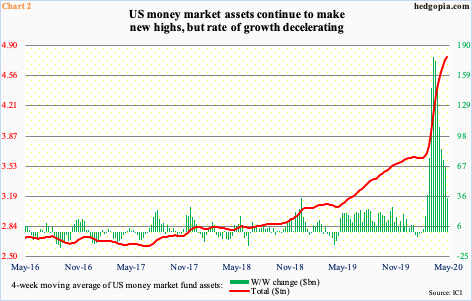
Cash is piling up on the sidelines. As of last Wednesday, money-market funds stood at $4.79 trillion, yet another record and up $1.4 billion from the prior week. On a four-week moving average basis, these assets were $4.77 trillion last week, up $34.4 billion week-over-week. The thing is, the w/w buildup is in deceleration (Chart 2). This is what equity bulls are counting on – reversal of the parabolic two-and-a-half-month rise in these assets. Should things evolve this way, what if equities get their fair share?
Will non-commercials afford to stay short?
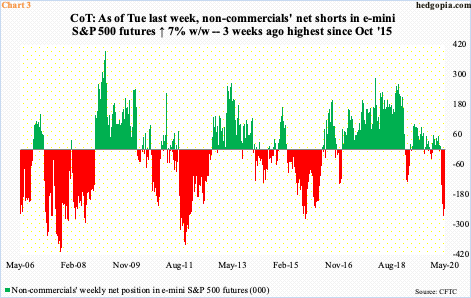
As of Tuesday last week they had racked up massive net shorts in e-mini S&P 500 futures – 252,863 contracts, slightly less than 265,608 three weeks ago, which was the highest since October 2015 (Chart 3). Back then, these traders were net short 278,179 contracts, before cutting back. The S&P 500 rallied eight-plus percent in October 2015. Non-commercials obviously got squeezed. Similar squeezes occurred in October 2011 and in September/October 2007. On both those occasions, net shorts were higher than the current levels – particularly in September 2007 when they amassed 408,653 contracts.
So, the question is if non-commercials start covering now or from a higher level. Timing notwithstanding, once this process begins, it can feed on itself. Bulls obviously hope this begins sooner.
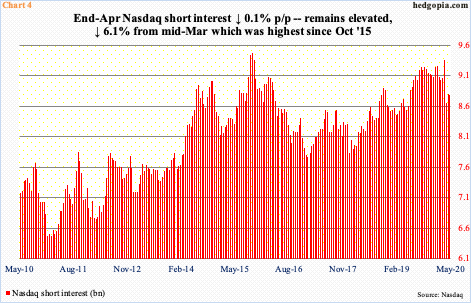
They are also salivating over Nasdaq short interest. By the middle of March, this had built up to 9.36 billion shares, which was the highest since end-September 2015. After a 24-session, 32.6-percent collapse, the index bottomed on March 23, as did other major equity indices. Short interest dropped 7.6 percent in the second half that month, to 8.65 billion. Shorts either locked in profit or decided it was time to cover sensing a decent bottom. Since then, short interest has inched up, but nothing major. That said, historically, the red bars in Chart 4 remain elevated.
The mid-May count is due out this Wednesday and should be interesting. The Nasdaq rose 1.4 percent in the first half this month. The question is if a decline in short interest played any role in this.

If so, from bulls’ perspective, there are tons of bears that are yet to jump on the bullish bandwagon. Amazingly, in the week to May 7, AAII (American Association of Individual Investors) bears were 52.7 percent. By then, the S&P 500 had already rallied north of 31 percent off of the March 23, low. Yet, bearish sentiment was the highest since April 2013 (Chart 5).
Since the high two weeks ago, bearish sentiment has dropped a bit, with last week at 45 percent, but remains very high – comparable to August 2010, February 2016 and December 2018 highs. Back then, stocks rallied nicely once bearish sentiment began dropping on a sustained basis. Bulls are hoping things evolve similarly this time around.
In this scenario, it is only a matter of time before the S&P 500, and other indices, break out of their recent range. If 3000 decisively falls on the S&P 500, stops get taken out and shorts likely move out of the way.
Then what?
As explained earlier, indices have had massive rallies from the March lows. The Nasdaq 100 is merely 3.4 percent from its February 19, record high, while the S&P 500 is 14.8 percent from its. Several indicators have rallied to overbought territory. Some are extremely overbought.
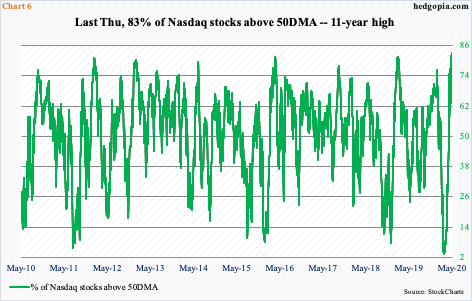
The percent of Nasdaq stocks above the 50-day last Thursday rose to 83 percent, before dropping a tad on Friday to 82.6 percent (Chart 6). Thursday’s reading was the highest since May 2009. Tech has been a leader, no doubt. But the action does not line up with the AAII bearish sentiment.
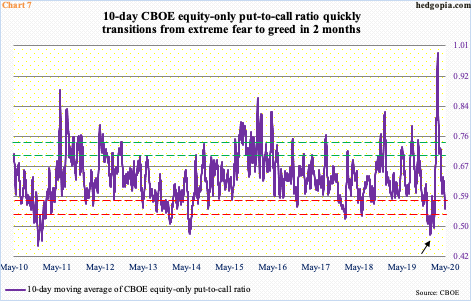
Neither does the CBOE equity-only put-to-call ratio. In the first three sessions last week, readings were in 0.40s, followed by 0.50s in the remaining two. Granted it was a week in which the S&P 500 rallied 3.2 percent, prompting bullish option activity. At the same time, sentiment has leaned bullish for several weeks now.
On February 19, which was the day the S&P 500 peaked, the 10-day average of the ratio printed 0.501. Leading up to this, it dropped as low as 0.48 on January 17, a nine-year low (arrow in Chart 7). Greed was extreme, the unwinding of which resulted in the February-March selloff in equities, leading to the spike in the 10-day to 0.989 by March 19. Fear was palpable then. Now, the pendulum has swung the other way. Last Thursday, the 10-day ratio dropped to 0.554, with Friday at 0.557. This is frothy territory. It is too soon to say if Thursday’s marks a bottom. In a scenario in which the S&P 500 takes out 3000, the 10-day ratio likely gets frothier, which by the way is what equity bulls are shooting for. But the lower the 10-day goes, the higher the odds the Johnny-come-latelies in particular, will be left holding the bag.


