
After Big Rally, Value-Conscious Investors In Particular Likely Get Tempted To Lock In Gains
Last Thursday’s sizable drop in major US equity indices was sudden. Several metrics were so deep into overbought territory the decline probably did not come as a surprise to many. The magnitude of it was. Indices have rallied in the 40 to 50 percent range in less than three months. Profit-taking is only logical. It likely continues in the weeks ahead.
Last week, before Thursday’s mini-collapse, most major US equity indices peaked on Monday. This includes large-, mid- and small-caps (represented by the S&P 500/400/600). Ditto with the Industrials and Transports in the Dow Jones family. The tech-heavy Nasdaq Composite (COMP), as well as the Nasdaq 100 (QQQ), were the exception, having peaked on Wednesday.
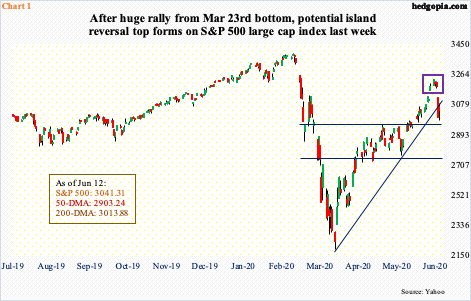
If there was any common thread in this, it was that all these indices gapped down big on Thursday. On all of them except the tech-heavy indices, this was preceded by a gap-up on the prior Friday. On the S&P 500 (SPY), as a result, an island has formed (box in Chart 1).This technical setup usually implies reversal. Since the March 23rd bottom, the trend has been up, so a reversal will be to the downside.
Thursday’s 5.9-percent tumble cost the S&P 500 (3041.31) its rising trend line from March 23rd. Friday’s high was rejected at the underside of that broken support; bulls were able to save the 200-day moving average in that session, but odds favor a breach in the sessions ahead. Nearest support lies at 2950s and after that 2760s.
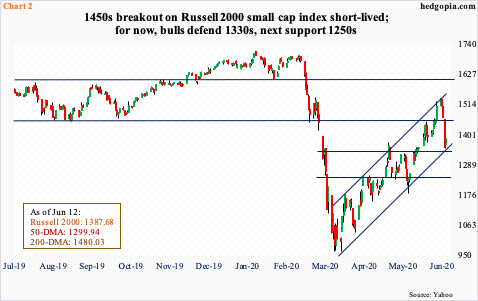
Over on the Russell 2000 (IWM) small cap index (1387.68), the story evolved similarly. Last Monday, it printed 1537.62. Just a session before that, it broke out of 1450s, raising hopes that this would now lead to a test of 1600-plus, which has proven to be an important price point going back to January 2018. However, after Monday, things unraveled quickly. Thursday, 1450s was lost – again – with the session essentially closing on another important support at 1330s. Thus far, small-cap bulls have defended this.
Along with 1330s, the Russell 2000 later last week also found support at the lower bound of an ascending channel (Chart 2). A loss of this should hasten a move toward 1250s. Alternatively, the index rallies to 1450s, gets denied and turns back down.
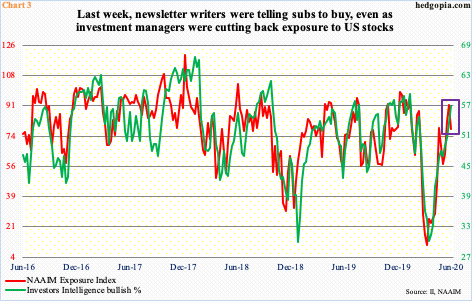
Interestingly, right before the rug was pulled out from underneath stocks last Thursday, NAAIM (National Association of Active Investment Managers) members cut their exposure to US equities. As of Wednesday, the NAAIM Exposure Index fell 14.1 points week-over-week to 77.5 (box in Chart 3). The 91.6 reading in the prior week was a 19-week high. These are elevated readings. In the week to March 18th, just before stocks bottomed, the index touched 10.7. Once unwinding begins in earnest, it has to go a lot lower before ‘froth’ is taken care of.
As opposed to NAAIM members, Investors Intelligence newsletter writers last week did not cut back on their optimism. In fact, bulls rose 3.4 percentage points w/w to 56.9 percent – a 20-week high. Just based on this metric, bulls are not out-and-out giddy yet, but readings are elevated enough unwinding can begin any time.
Here is the fun part. At the end of March, shortly after stocks bottomed, the sell-side expected S&P 500 companies to earn $157.91 this year and $183.37 next. As of June 3rd, these estimates are down to $109.71 and $161.80. With the index having recouped most of its February-March collapse, investors are increasingly paying a higher multiple.
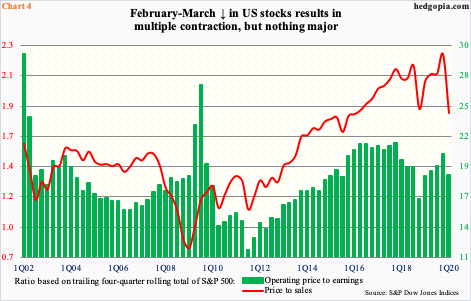
Using actual operating earnings and sales for the trailing 12 months through March, multiples were anything but reasonable. At the end of 1Q, the price-to-sales ratio was 1.83x and the operating P/E 18.6x (Chart 4). This, of course, reflected the February-March drop in the S&P 500.
Prices since have recovered but estimates are lower. The resulting multiple expansion can tempt value-conscious investors into locking in gains. Logically, those that got out last Thursday are not going to get back in unless the S&P 500 is meaningfully lower.
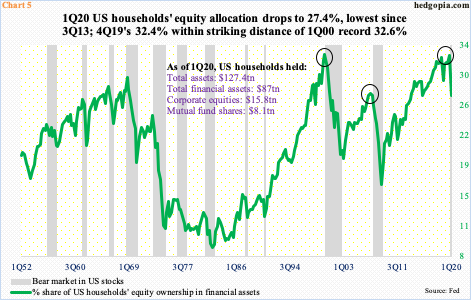
Similar dynamics are in play in Chart 5.
In 4Q19, US households’ equity allocation reached 32.4 percent, only two-tenths of a percentage point from the 1Q00 record high 32.6 percent. Soon, gravity worked its magic. The February-March drop in stocks brought this allocation down to 27.4 percent. This was essentially on par with 27.7 percent in 2Q07, which was the high in that cycle and was recorded just before stocks peaked in October that year.
Besides, the recovery in stocks since the March 23rd low must have pushed this metric right back up. In other words, not much unwinding has taken place. In the last two bear markets, it dropped to mid to high teens before bottoming.
This runs counter to what is transpiring in the economy. Granted the Covid-19 crisis came out of nowhere, the fact remains that it will take time for the economy to crawl out of the hole it is in. It is fashionable to talk about a V-shaped recovery, but reality is probably the opposite. Last Wednesday, speaking to the press post-FOMC meeting, Fed Chair Jerome Powell could not have been clearer in his message when he said a long road lies ahead.
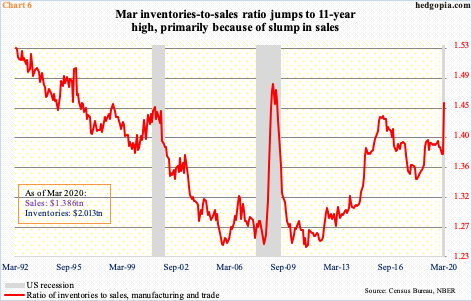
Chart 6 is one of the data points providing a window into what lies ahead. It presents a ratio of inventories to sales in manufacturing and trade. In March, it rose to 1.452 – an 11-year high. Sales were $1.39 trillion and inventories $2.01 trillion. The latter peaked at $2.03 trillion last July, while the former was $1.47 trillion as recently as January. Apparently, behind the jump in the ratio is the recent slump in sales, not so much inventory accumulation. That said, unless the economy recovers with a V – not likely – it will take time to soak up all the existing stocks, which will then adversely impact production.
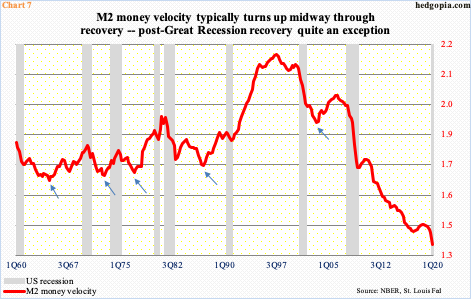
As things stand, the M2 money velocity is set to drop to a new low in the current quarter. In 1Q, it fell to 1.37. Ironically, it has trended lower since peaking at 2.20 in 3Q97 (Chart 7). In the prior expansion, which through February this year lasted 120 months, the metric was 1.71 when Great Recession ended. Velocity briefly rose to 1.74 in 2010, and then it was all downhill. In past expansions, velocity tended to turn back up midway through the cycle, which failed to materialize in the last cycle.
In its simplest form, it is a growth problem. In the last cycle, nominal GDP grew 50 percent, while M2 money supply jumped 91 percent. Money in circulation is not being exchanged fast enough. Alternatively, too much money is being created. Or, more money is increasingly needed to produce the same output. As the Fed pushed on the stimulus accelerator this year, M2 money supply went from $15.5 trillion in February to $18 trillion in May; GDP obviously took a hit during the period.
The persistently falling velocity increasingly looks like a structural problem, not cyclical. Unless it is different this time, in the long run, stocks should reflect this. Near-term is another matter. In fact, stocks cheered the Fed stimulus, bottoming on the very same day the Fed announced an open QE. The massive rally from that low has given longs massive gains on paper. Some decided to lock it in last Thursday. More profit-taking likely follows in the sessions/weeks ahead.


