
After Big 1-Year Gains, Small-Cap Investors Are Itching To Cash In
One year ago this month, amidst all the gloom and doom, small-caps bottomed. Now, amidst high optimism for GDP and earnings growth, sellers are itching to cash in on their massive gains.
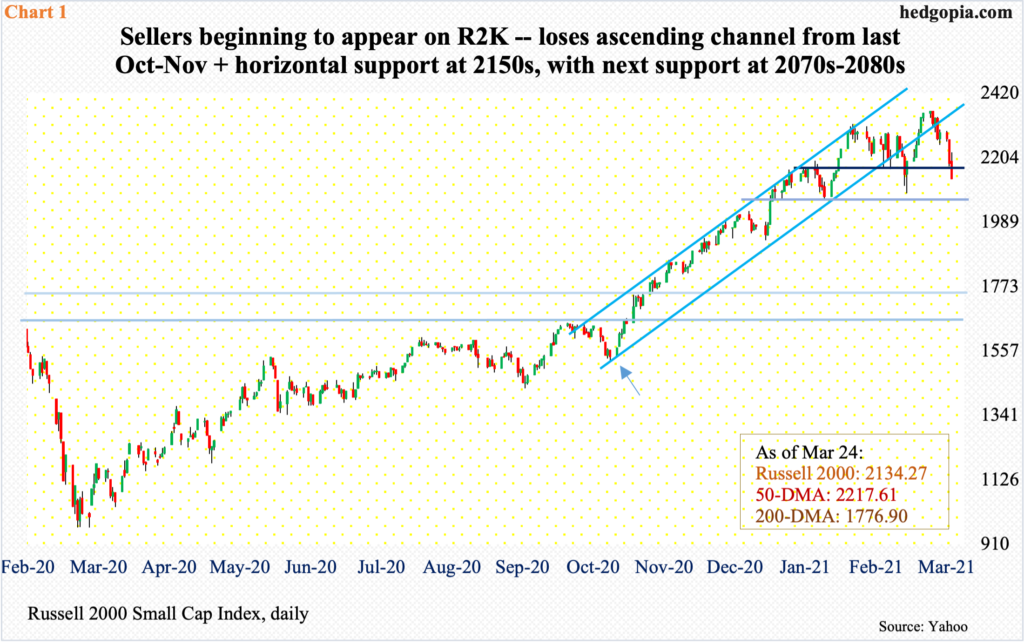
After a massive one-year rally, small-caps look ripe for a correction at best and worse at worst. The Russell 2000 surged 144 percent between the low of 966.22 on March 18 last year and the high of 2360.17 on the 15th this month.
Through Wednesday, the small cap index is down 9.6 percent from that high. Earlier, between February 10 and March 5, it shed 10.1 percent before regaining its footing; but the rally that followed just about stopped at the underside of a broken ascending channel from last October-November (Chart 1).
There was short-term horizontal support at 2150s, which, too, has been breached, albeit slightly. Just underneath, there is another layer of straight-line support at 2070s-2080s. A loss of this can swing momentum to bears’ favor – timing and magnitude notwithstanding.
The index (2134.27) has lost the 50-day (2217.61). This was the first time it closed under the average since last October.
Small-caps’ wobbly action is coming at an interesting time.
Last year, these stocks – and large- and mid-caps as well – bottomed in the throes of COVID-19 disruptions. Now, sellers are showing up even as the US economy is expected to boom this year, with growth slowdown in subsequent years. At the end of last week’s meeting, the FOMC revised higher its 2021 real GDP forecast from 4.2 percent last December to 6.5 percent; 2022 growth is then expected to soften to 3.3 percent and 2023 to 2.2 percent.
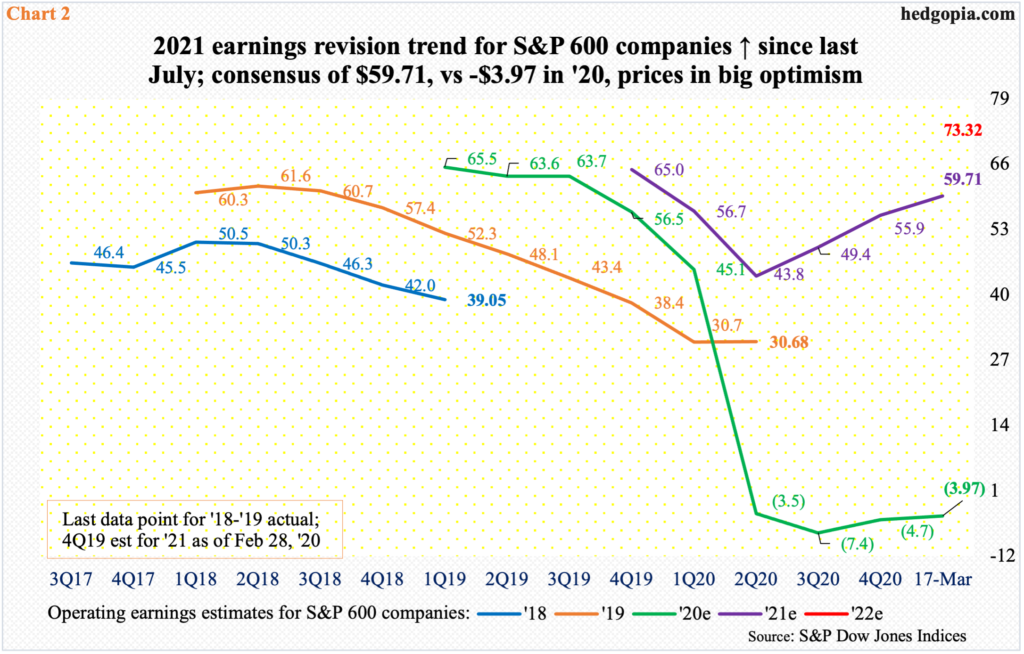
Earnings portray a similar trajectory. Operating earnings estimates for S&P 600 companies are expected to come in at $59.71 this year – a massive reversal from a loss of $3.97 last year. The momentum is expected to continue next year but with deceleration, with the consensus penciling in $73.32 (Chart 2).
Amidst this massive sell-side optimism comes how small businesses perceive where things are headed. Right here and now, they are not as optimistic, to say the least.
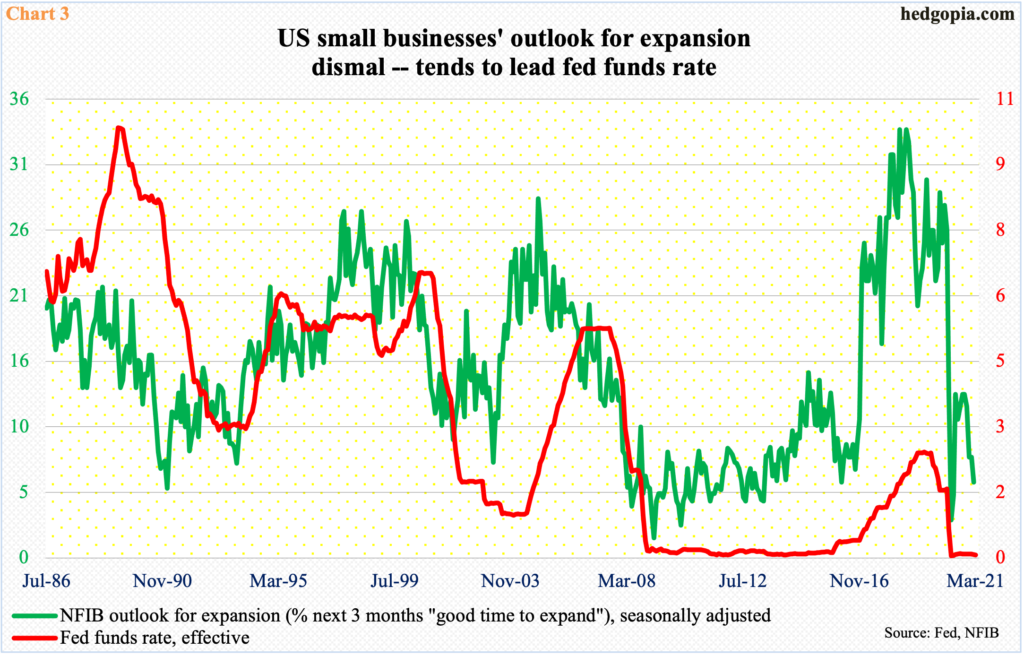
In February, the NFIB Optimism Index inched up 0.8 points month-over-month to 95.8. It is below the pre-pandemic high of 104.5 in February last year but above April’s low of 90.9. More noteworthy is how suppressed their expansion outlook is for the next three months, which dropped two points m/m in February to six – not too far away from last April’s three (Chart 3).
It turns out their outlook tends to precede the fed funds rate, which between zero and 25 basis points essentially remains zero-bound. As things stand, these businesses are not ready to aggressively invest in expansion, which will suggest the benchmark rate remains where it is for the foreseeable future, and this in and of itself is a sign of the prevailing fragility, regardless of the stimulus-spurred boom this year.
Historically, small-business sentiment does better when rates are moving up – until they reach a level the economy begins to get hurt.
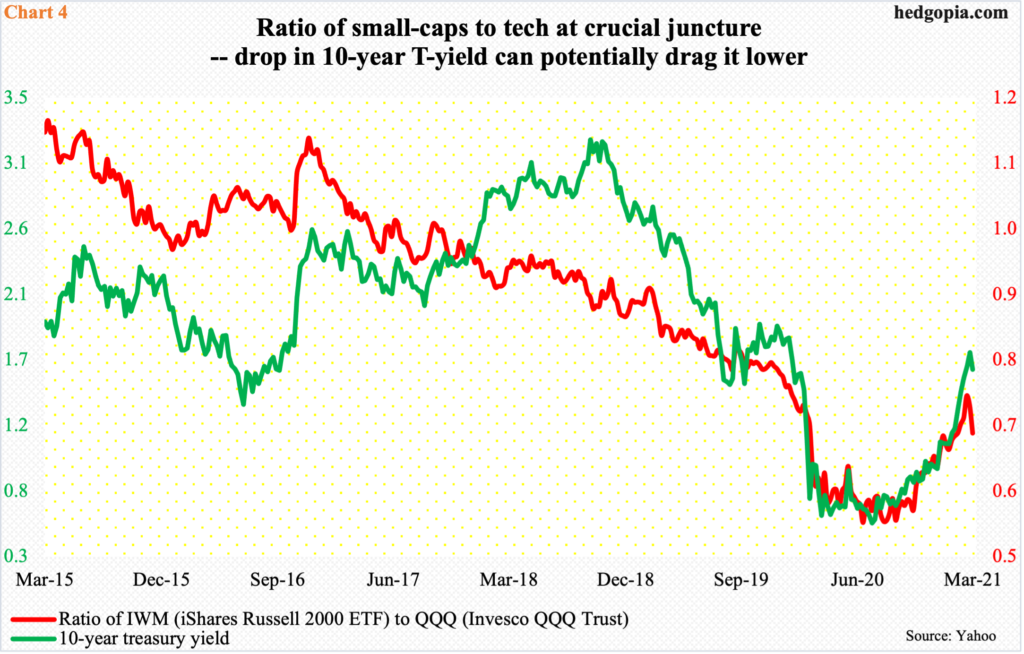
The long end of the treasury yield curve bottomed last March as well, with the 10-year touching 0.4 percent. Fast forward to this month, these notes yielded 1.75 percent on the 18th. Wednesday, rates closed at 1.61 percent – right at horizontal support.
The 10-year remains overbought, and the weekly in particular has tons of room to head lower. If the current support is breached, the next decent support is not until 1.4-1.5 percent. Continued unwinding of these overbought conditions could put the ratio of (IWM) iShares Russell 2000 ETF to (QQQ) Invesco QQQ Trust under continued pressure (Chart 4).
Post-November 3 election last year, and in particular in the wake of Pfizer’s (PFE) announcement of vaccine on the 9th that month, investors aggressively went for small-caps at the expense of tech – the so-called growth-to-value shift.
Tech continues to act like a sick puppy. QQQ – once again – failed to reclaim the 50-day on both Monday and Tuesday this week. It already lost a rising trend line from last March’s low. Speaking of which, IWM, too, lost its 50-day this week – the first time it closed below the average since last October. The weakness likely continues in the weeks ahead – both on an absolute basis and relative to QQQ.
Thanks for reading!


