
After 9 Weeks Of Rally, Signs Of Fatigue Last Week On Russell 2000/IWM
US stocks are on fire. The Russell 2000/IWM was essentially unchanged last week, with the index down 0.03 percent and the ETF up 0.06 percent. This followed nine weeks of persistent rally, during which they jumped 34 percent. Conditions are extremely overbought. Amidst this, the Russell 2000 last week flashed a spinning top candle near crucial resistance. Small-cap bulls still have the momentum ball but run a risk of losing the grip.
These are interesting times.
In the past five months, US stocks seesawed. The October-December decline was scary. Bears put up quite a show. The rally since the late-December low has been no less impressive. Bulls have wrested control of the momentum ball. During all this, earnings estimates just kept going lower. In fact, estimates peaked much earlier.
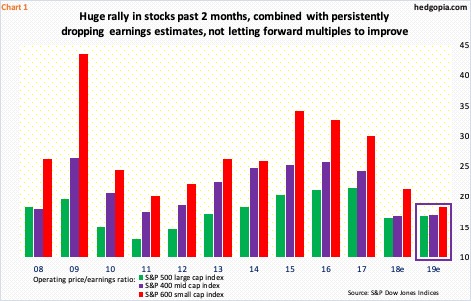
Operating earnings estimates for this year for S&P 500 companies (large-caps) peaked at $177.13 early August last year; at the end of February, they were $166.06. For S&P 400 companies (mid-caps), 2019 estimates peaked mid-October last year at $124.32 and for S&P 600 companies (small-caps) at $61.63 late June last year; they are now $113.82 and $53.71, in that order.
As a result, forward multiples, which began to look reasonable toward the end of December, are once again elevated. On 2019 earnings, the operating P/E for both S&P 500 and 400 companies are 16.9x, and 18.2x for the S&P 600 (Chart 1).
The spike in 2018 earnings was primarily due to the tax cuts of December 2017. With 96 percent of S&P 500 companies having reported their 4Q, 2018 estimates at the end of February were $151.06, versus $124.52 in 2017. For the S&P 400, 2018 was at $98.59 and 2017 at $78.12, and for the S&P 600, they were respectively $39.73 and $31.19.
At the beginning, the sell-side was very enthusiastic about 2019 prospects, but with no visible tailwind, reality began to sink in. In all probability, the prevailing downward revision continues in the months/quarters ahead.
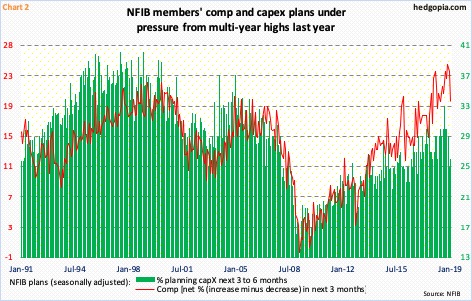
In a lot of ways, these analysts are simply reacting to what ‘macro’ is giving them. Small businesses were expected to be the biggest beneficiaries of the tax cuts. Optimism was giddy last year. In November, NFIB members’ comp plans reached a 29-year high, while their capex plans in August matched a high of 12 years ago. Now, both of these metrics are under pressure (Chart 2).
The benefits from the tax cuts, followed by a fiscal stimulus, are wearing off. The economy is in clear deceleration. Growth in real GDP went from 4.2 percent in 2Q last year to 3.4 percent in 3Q to 2.6 percent in 4Q. As of last Friday, the Atlanta Fed’s GDPNow model forecasts growth of mere 0.3 percent in the first quarter this year.
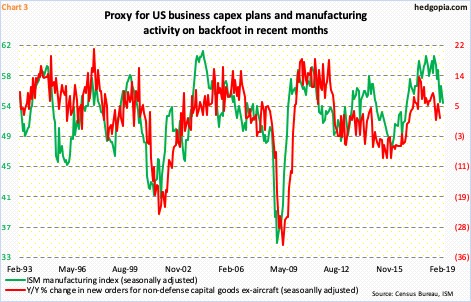
The ISM manufacturing index reflects this. The August 2018 high of 60.8 (60.7 in February 2018) was the highest reading since 61.4 in May 2004. As Chart 3 shows, it is hard to sustain above 60. In February, the index fell 2.4 points month-over-month to 54.2.
Several other metrics are following suit, not the least of which is orders for non-defense capital goods ex-aircraft. This can be used as a proxy for businesses’ capex plans. In the 12 months to December, orders rose two percent to a seasonally adjusted annual rate of $68.2 billion. As recently as July last year, they jumped at an 8.8-percent pace, and at 13.3 percent in September 2017.
It is possible these deteriorating fundamentals are leading non-commercial futures traders to now lean, or stay, bearish stocks.
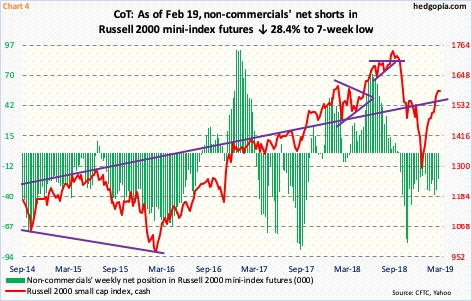
In the last week of September last year, non-commercials switched to net short Russell 2000 mini-index futures. In the next four weeks, their holdings jumped to a 13-month high. They have since cut back but are staying net short (Chart 4). (Data is as of February 19. The CFTC will publish data for the week ended February 26 tomorrow. After this, it will follow the normal schedule of once-a-week publication each Friday.)
Non-commercials’ bearish leaning is also evident in e-mini S&P 500 futures and Nasdaq 100 index (mini) futures. In the former, these traders have stayed short for five straight weeks now and for eight in the latter’s case. This is taking place even as all these three indices have rallied to crucial resistance – the S&P 500 (2803.69) to 2800, the Nasdaq 100 (7151.57) to 7100 and the Russell 2000 (1589.64) to 1600.
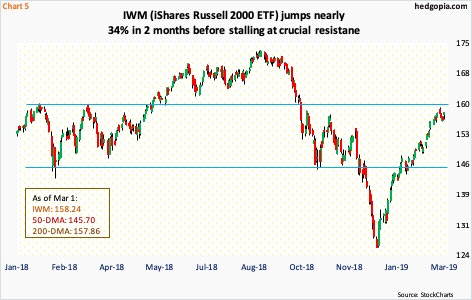
Last week’s action in the Russell 2000/IWM (iShares Russell 2000 ETF) in particular was interesting. Monday, the Russell 2000 rallied to 1602.10 before pulling back. On IWM, this corresponded to $159.50. For the week, it edged higher 0.06 percent – its 10th straight positive week. From the Boxing Day low of $125.81, it rallied nearly 34 percent. Conceivably, if a breakout occurs here, non-commercials are likely to reconsider their bearish thesis, and may even jump on the bullish bandwagon.
That said, bulls have expended a lot of energy in rallying thus far. Given the significance of the aforementioned resistance, at least a stall here is the path of least resistance. Last week, the Russell 2000 produced a spinning top candle. This, even as optimism remains elevated.
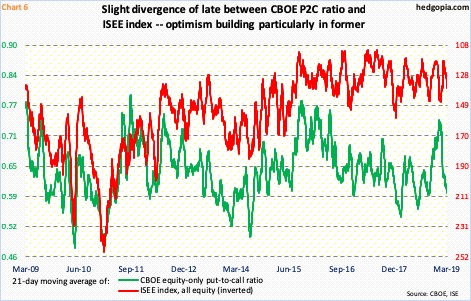
In the options market, there has been a slight divergence of late between the CBOE equity-only put-to-call ratio and the ISEE index (all equity), but both paint a buildup in optimism. This is particularly evident in the CBOE put-to-call ratio.
Chart 6 calculates a 21-day moving average, and on this basis, the CBOE put-to-call ratio dropped from 0.744 on December 24 (the S&P 500 bottomed on December 26) to 0.594 last Friday. Back in December, traders/investors were too fearful, now they are way giddy. Historically, equities have tended to retreat as the ratio reaches mid-to-high 0.50s.
Should ‘risk-off’ develop in the sessions/weeks ahead, this should begin to first get reflected in small-caps. A little bit of fatigue showed up in last week’s action. In this scenario, a trade could be brewing in IWM ($158.24) using options.
Hypothetically, an April 5th 159.50/161.50 credit call spread earns $0.84 in premium (159.50 sells at $2.01 and 161.50 at $1.17). A 145 short put earns another $0.43 – $1.27 in total. It is a two-point spread, hence $0.73 will be at risk, breaking even at $160.77. The ETF needs to rally 1.6 percent for the trade to slip into the red. Down below, the short put will be exercised should the underlying drop 8.4 percent from Friday’s close, but because of the premium earned does not start bleeding until it drops to $143.73.
Disclaimer: This article is not intended to be, nor shall it be construed as, investment advice. Neither the information nor any opinion expressed here constitutes an offer to buy or sell any ...
more

