
Absolute And Relative Performance Of Apple´s Stock Price At All-Time Highs
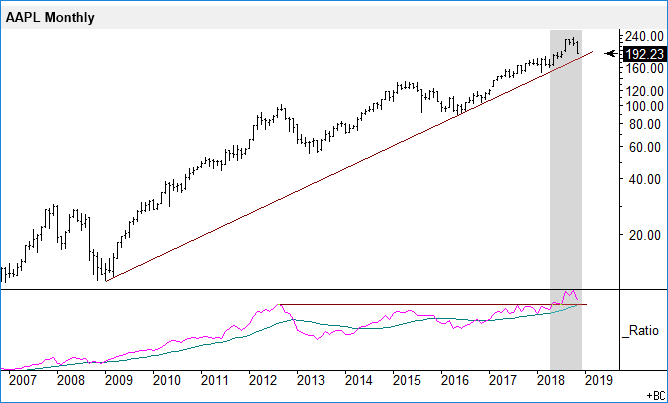
Below is a monthly semi-log chart of Apple´s stock price. It is obvious that the trend is up. What is even more interesting is what the lower panel shows. It shows the relative performance of Apple´s stock price against the S&P 500 index. In the middle of this year, the ratio line rose above its 2012 high while the stock price hit new all-time highs. This has to be considered very bullish for the broad market going forward, although a little rest is perhaps needed first.
Disclosure: The analysis provided here is usually part of the analysis the author uses when he is designing and managing his investment portfolios.
Disclaimer: The analysis presented ...
more
How did you like this article? Let us know so we can better customize your reading experience.

Comments
Leave a comment to automatically be entered into
our contest to win a free Echo Show.

