
Above The 40 – The S&P 500 Slips, Not Falls, Off The Edge
AT40 = 58.7% of stocks are trading above their respective 40-day moving averages (DMAs)
AT200 = 59.4% of stocks are trading above their respective 200DMAs
VIX = 10.3 (volatility index)
Short-term Trading Call: cautiously bullish
Commentary
When AT40 (T2108), the percentage of stocks trading above their respective 40-day moving averages (DMAs), fades from overbought status, I take note. A fade from overbought means that buyers are not strong enough or sufficient enough to keep lifting all boats in the rising tide of the stock market. If the S&P 500 (SPY) continues to rise while AT40 declines, I flag a bearish divergence that is supposed to bode poorly for the sustainability of future gains for the general stock market.
In January and February of this year, AT40 faded multiple times from overbought status and eventually went into a definitive bearish divergence with the S&P 500. However, when the declining AT40 finally weighed down the major indices on March 2nd and more dramatically on March 21st, the indices sold off from levels much higher than the January and February trading levels. The selling was also collectively mild and 50DMA support held on both the S&P 500 and the Nasdaq.
A more distinctive fade from overbought status came on April 26th. This time, the S&P 500 went nowhere until, all of the sudden on May 17th, the sellers took over all the trading action. The sellers were able to gap the market down the next day, but the indices rocketed higher from there and never looked back.
The latest fade from overbought levels happened from July 20th to the 26th. So of course I think that the sudden swoon on July 27th was related to buyers running out of steam as suggested by AT40’s fade. Yet, there is a tension here. If this pullback is like all the others for 2017, then it will be short-lived; in the rearview mirror, the selling will look like yet one more speedbump to higher prices. On the other side, seasonality and the extended amount of time that AT40 has spent below overbought status suggest that the S&P 500 should at least flatten out for the next few months if not sell-off altogether. Since sellers have consistently failed to follow-through in this market, I am keeping my short-term trading call at cautiously bullish under these conditions. This is why when the swoon descended upon the market, I was quickly covering shorts, locking in profits on put options, and looking for fresh buys.
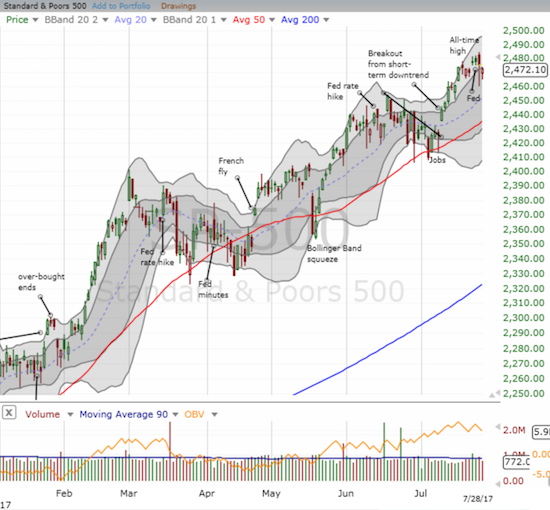
The hiccup on the S&P 500 (SPY) took the index below its upward trending channel formed by its upper-Bollinger Bands. It took Friday’s small gap down to confirm the breakdown.

The hiccup on the Nasdaq looks more bearish as Thursday’s selling formed a classed bearish engulfing topping pattern.
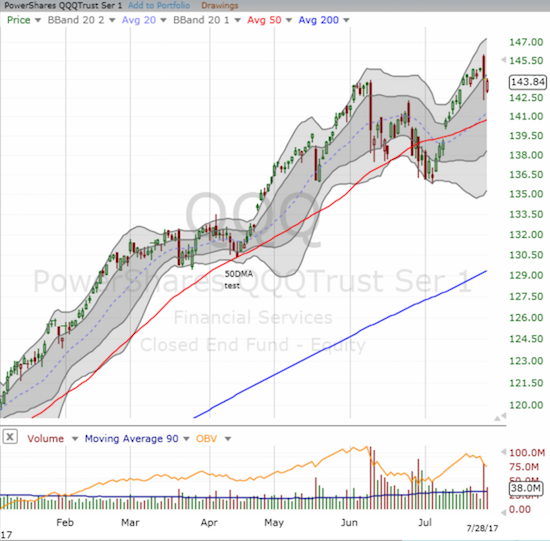
The PowerShares QQQ ETF looks as toppy as the Nasdaq with its own bearish engulfing pattern.
The behavior of the volatility index, the VIX, was telling. On Thursday, the VIX first gapped down to 9.2 and then rocketed as high as 11.5. The fade from there was sharp and closed the VIX at 10.1. On Friday, the VIX gapped higher, traded higher, but then faded into a close of 10.3. Through the gyrations, I never even bothered going long volatility products. Instead, I bought a single call option on ProShares Short VIX Short-Term Futures (SVXY) that I decided to hold for a potential post-weekend volatility implosion.
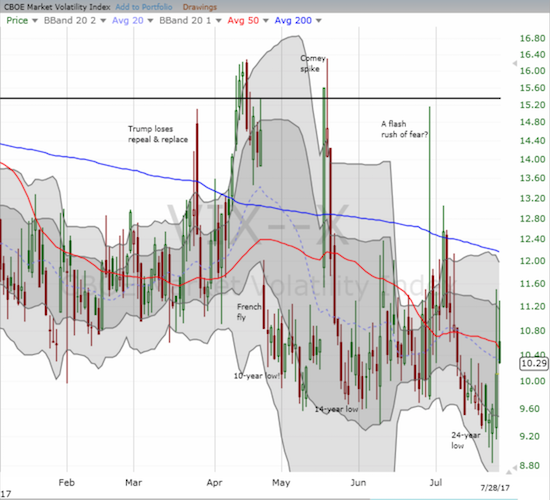
The volatility index, the VIX, sprang to life last week but still struggled to hold onto gains.
Let’s see where the sell-off left the usual suspects, especially given the toppy look of the tech-laden indices. Note that last week was full of earnings from the usual suspects: Alphabet (GOOG) reported Monday, July 24th. Amazon.com (AMZN) reported earnings Thursday night. Facebook (FB) reported earnings on Wednesday night.
- Alphabet: Broke down below 50DMA support for the second time in a month.
- Amazon.com: Gapped and crapped on Thursday. Gapped down post-earnings but traded across a wide range. I was primed and ready for my typical post-earnings trade on AMZN, but the market never filled my order on a call spread. I was also too tentative to day trade the almost predictable bounce from the lows just above $1000/share and 50DMA support.
- Apple (AAPL): Combined with news about the official end-of-life (EOL) for the iPod Nano and Shuffle, sellers really got busy on Thursday on AAPL. AAPL traded down as much as 4.0%. I bought call options furiously given such a decline is a substantial extreme for AAPL, and the headline news was irrelevant to AAPL’s financial performance. I was pleasantly surprised to lock in a 50% gain by the close. On Friday, I bought a fresh tranche (just one call option went through) for what I hope will be a pre-earnings trade. AAPL closed the week clinging to 50DMA support.
- Facebook: The uptrend remains well intact, and on Friday FB ended the day at a new closing all-time high.
- Netflix (NFLX): NFLX lost all its post-earnings gains starting from the second day of post-earnings trading. The stock closed the week at the bottom of its upward-trending Bollinger Bands (BB).
- Nvidia (NVDA): NVDA bounced off uptrending 20DMA support at its lows on Thursday. It reversed half its loss from Thursday.
Together, the usual suspects do not reflect the toppy bearishness in the tech indices – very surprising.
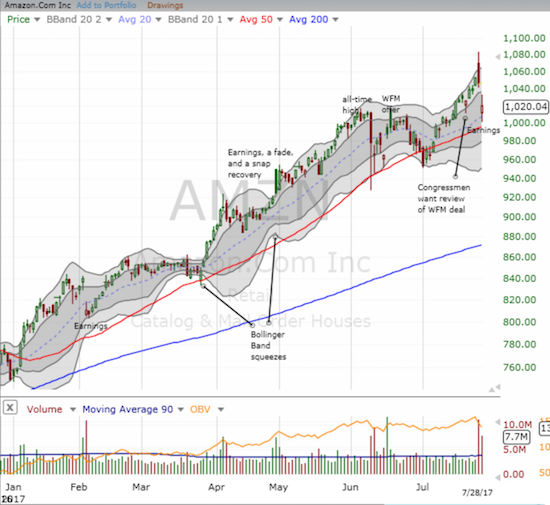
Amazon.com soared into earnings but fell off the ledge…
In other trading action…
Dominos Pizza (DPZ)
Traders and investors reacted poorly to DPZ earnings. The stock closed the week clinging to 200DMA support. I decided to speculate on a bounce from support for this amazing momentum stock.
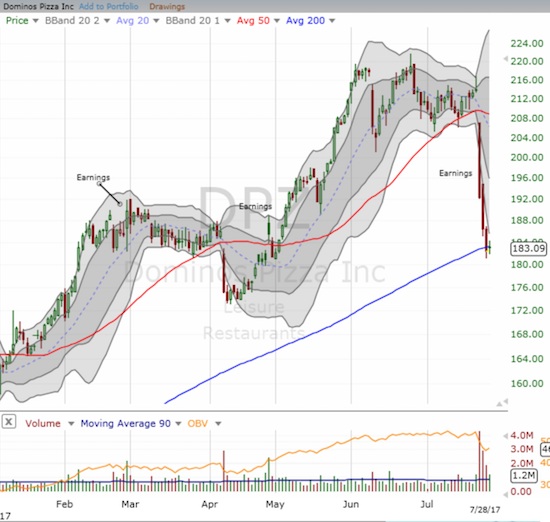
Dominos Pizza is facing a critical challenge as post-earnings selling plunged it head on into 200DMA support.
Best Buy (BBY)
The trade in BBY was supposed to be simple, but the stock refuses to be defined by its position relative to its 50DMA. BBY has pivoted around its 50DMA several times. The latest move has taken BBY close to a reversal of its post-Amazon Panic gap down. I decided to stick to a short here: I like the position as a hedge against being long the market…not to mention the negative (Amazon Panic) catalysts are starting to add up for BBY.
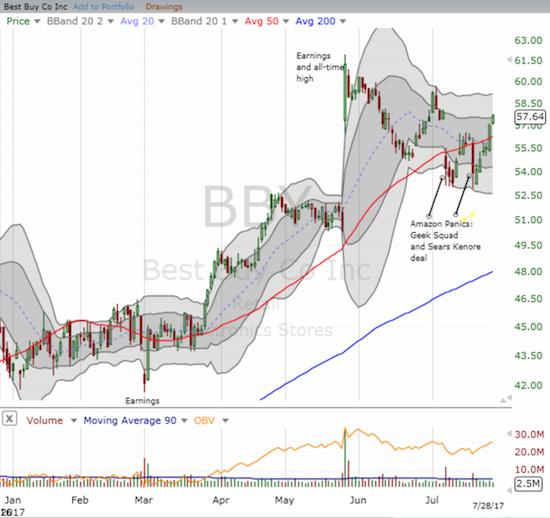
Best Buy closed the week by finishing a reversal of the first Amazon Panic selling.
Target (TGT)
I locked in profits on my post-guidance trade in TGT. The stock produced a nice and steady confirmation of its 50DMA breakout.
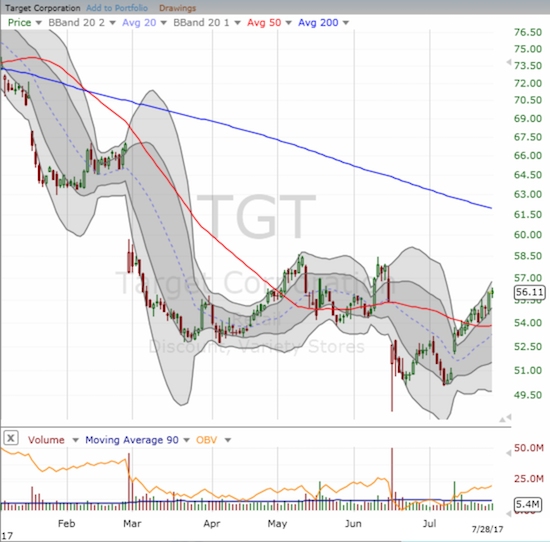
The post-guidance buying in Target succeeded in filling the Amazon Panic over the Whole Foods deal.
SPDR® S&P Retail ETF (XRT)
Retail generally had a good week that was capped by news that the border tax idea officially died. This legislation was a fascinating battle of lobby versus lobby. Domestic manufacturers loved the idea. Major importers, particularly retailers, hated it. The news was so good for retailers that XRT was able to rally for a 1.4% gain while the major indices were down sharply on Thursday.
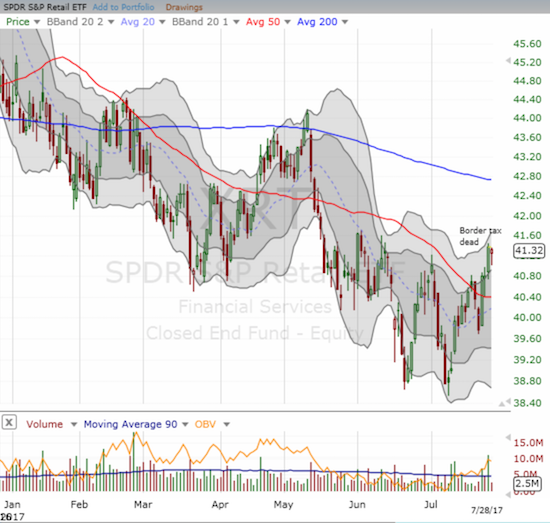
The SPDR® S&P Retail ETF followed through on its 50DMA breakout thanks to the death of the Border Tax.
U.S. Steel (X)
Just when I thought U.S. Steel propelled itself to “escape velocity” with its last earnings report, analysts swooped in for major doses of reality. Particularly damaging was Citigroup’s Friday call to sell X. X lost 8.1%, completed a post-earnings reversal, and now looks set to test 50DMA support again. I am 50/50 on whether I will buy into such a test.
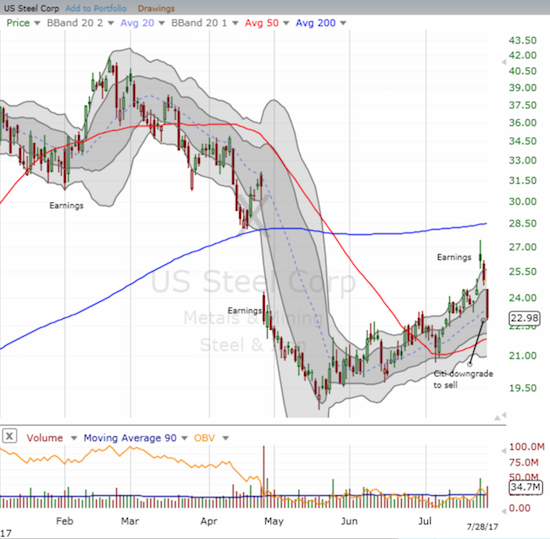
The market dealt U.S. Steel a serious blow to its recovery efforts with such an ugly post-earnings fade.
Chipotle Mexican Grill (CMG)
Like retailers, CMG was able to skate right past the sellers on Thursday. News about a SEC disclosure did not impact CMG at the open as I had thought. I scrambled to get my call option as planned. Once the call option put on a nice profit, I decided to try to let it run with a stop. Unfortunately, the market took out my stop…and then proceeded to rally more. I had to come back for more on Friday and buy as CMG faded from what was looking like an important post-earnings breakout day. Regardless of the outcome of my latest tranche of call options, CMG looks like it is trying to bottom. If this bottom, fails it will immediately turn into a major short again.
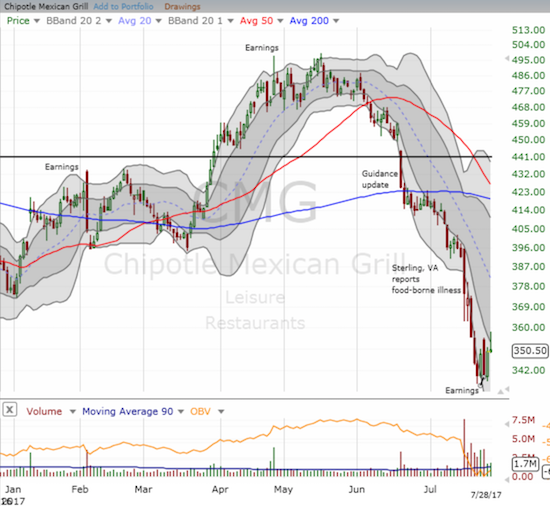
Chipotle Mexican Grill looks like it is bottoming with sellers unable to crack the recent (post-earnings) low.
Active AT40 (T2108) periods: Day #364 over 20%, Day #178 over 30%, Day #45 over 40%, Day #16 over 50% (overperiod), Day #1 under 60% (underperiod), ending 10 days over 60%), Day #124 under 70%
Daily AT40 (T2108)

Black line: AT40 (T2108) (% measured on the right)
Red line: Overbought threshold (70%); Blue line: Oversold threshold (20%)
Weekly AT40 (T2108)

*
All charts created using freestockcharts.com unless otherwise stated
The charts above are my LATEST updates independent of the date of this given AT40 post. For my latest AT40 post click here.
Disclosure: long AAPL call option, long SVXY call option, short BBY, long CMG call options, long DPZ call option
*Charting notes: FreeStockCharts.com uses midnight U.S. Eastern time as the close ...
more

