
Above The 40 – S&P 500 Breakdown Confirms Earlier Bearish Signals
AT40 = 48.3% of stocks are trading above their respective 40-day moving averages (DMAs)
AT200 = 50.4% of stocks are trading above their respective 200DMAs
VIX = 17.9
Short-term Trading Call: bearish
Commentary
The trading action this week confirmed the bearish change in trading that occurred when AT40 (T2108), the percentage of stocks trading above their respective 40-day moving averages (DMAs), was quickly ejected from the last overbought period. Recall that shift in momentum also came with the Fed’s last pronouncement on monetary policy; the S&P 500 (SPY) has faltered after all four Fed meetings this year with a quick rebound and recovery coming only in the May meeting.
AT40 closed yesterday at 48.3%; it closed last week at 63.1%. The rapid decline over the last 2 of 3 days means the selling is getting a bit extreme, making the market prone to a sharp rebound and relief rally on even the slightest whiff of good news. I am maintaining a bearish short-term trading call, especially given the S&P 500 (SPY) cracked 50DMA support. On Monday, buyers were able to save the S&P 500 from a 50DMA breakdown. Not this time.
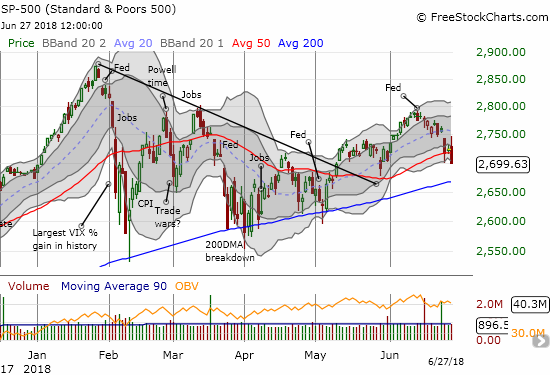
The S&P 500 (SPY) lost 0.9% on its way to slicing through 50DMA support and closing slightly below its lower-Bollinger Band (BB).
Yet another test of uptrending 200DMA support is in play for the S&P 500. Note well that the lower-Bollinger Bands (BBs) are starting to point downward.
Last week it was the S&P 500 cracking its uptrending 20DMA before the tech-laden indices. This week, the drama is around the 50DMA. While the S&P 500 failed 50DMA support, the Nasdaq and the Invesco QQQ Trust (QQQ) are still trying to hold this critical line of support. On Monday, buyers rushed in just above the 50DMAs right on schedule. Yesterday, the indices closed at their lows of the day making support look particularly precarious.
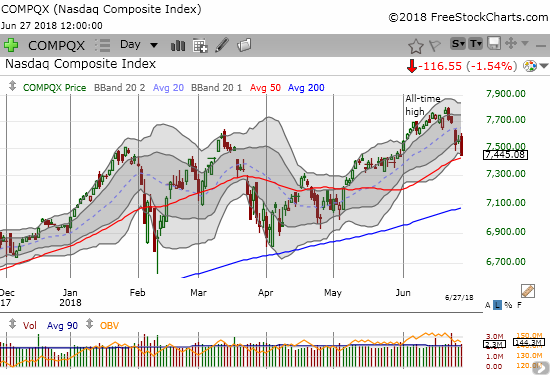
The Nasdaq tumbled 1.5% right to its uptrending 50DMA support.
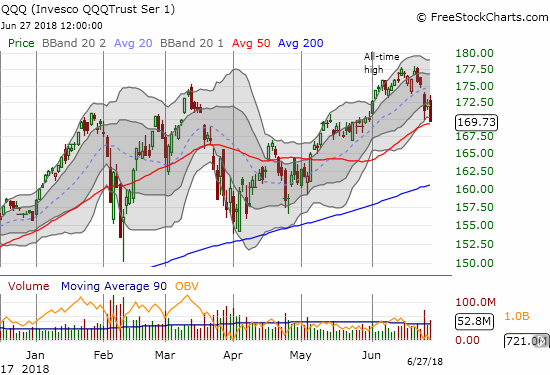
The Invesco QQQ Trust (QQQ) dropped 1.4% to close just above its 50DMA support.
The perceived “safety” of tech and small cap stocks came to a conclusive end with iShares Russell 2000 ETF (IWM) losing 1.5% in parallel with the steep losses in tech stocks. IWM is in better shape though with still a bit of distance between Wednesday’s close and 50DMA support.
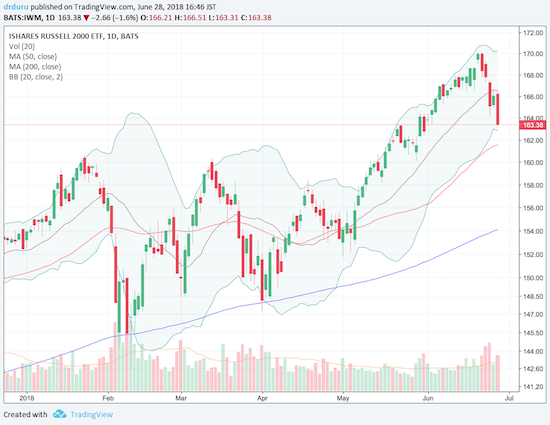
The iShares Russell 2000 ETF (IWM) is tumbling sharply off its high perch.
Source: TradingView.com
The volatility index, the VIX, gained 12.5% to close well above the 15.35 pivot again. The 2-month closing high confirms the bottoming I noted last week and underlines a change from complacency to growing fear. However, with the VIX closing with a 25.8% gain on Monday, history suggests that this is the beginning of the end of latest cycle of fear. At its high on Monday, the VIX gained over 40%.
#VIX up about 34%. Was up as high as 42%. Time and again market has proven these gains are hard to sustain for long... $SPY $VXX $UVXY pic.twitter.com/Cb01PWqN4d
— Dr. Duru (@DrDuru) June 25, 2018
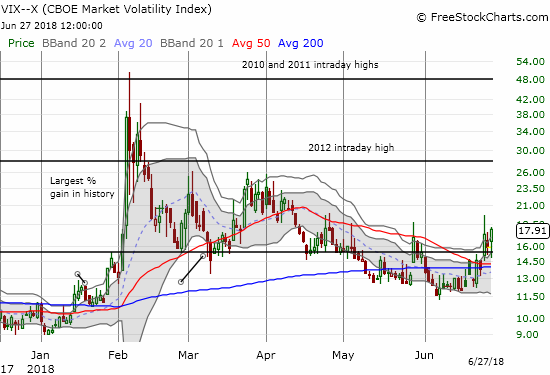
Fear is ramping up as the VIX confirmed a bottom around the 12 level and is now pulling away from the 15.35 pivot.
While the trading this week confirmed my bearish trading call, I traded in deference to the market’s ability to bounce back and rally. For example, on Monday, I took profits on almost all my put options while leaving in place short positions. I also bought a few long positions; I mainly used calendar call spreads in anticipation of the short side expiring worthless this week and the long side have a better than 50/50 chance of helping me ride a relief rally by next week. On Tuesday and Wednesday morning, I faded strength by rushing right back into put options. I took profits on most of these new positions into the teeth of the selling that eventually overwhelmed buyers. I do not like this back and forth – particularly because I end up leaving money on the table – but I find it necessary with headlines taking sentiment on a roller coaster.
My trades around volatility provide a great example of my attempt to stay one step ahead of the market’s shifting manic moods. Per my plan, on Monday morning’s volatility spike, I took profits on my call options on ProShares Ultra VIX Short-Term Futures (UVXY). As volatility kept rising, I shorted shares of iPath S&P 500 VIX ST Futures ETN (VXX). When volatility took a dive Tuesday morning, I quickly took profits and covered my short. I meant to get back into UVXY call options but failed to notice that my limit order did not fill by the market’s close. Fortunately, I already started rebuilding a fresh tranche of put options on SPY. I failed to get more UVXY calls Wednesday morning, but I did add to SPY puts and opened a sizeable position in QQQ puts. I took profits on the SPY puts after the 50DMA support gave way. I took profits on the QQQ puts as the tech-laden ETF hit its lower-Bollinger Band (BB). I ended the day short VXX again. Whew!
The currency markets are providing good guideposts to market sentiment and direction. The Australian dollar (FXA) versus the Japanese yen (FXY) continues to betray the market’s underlying weakness. AUD/JPY peaked three weeks ago; it is flirting with a fresh 19-month low.
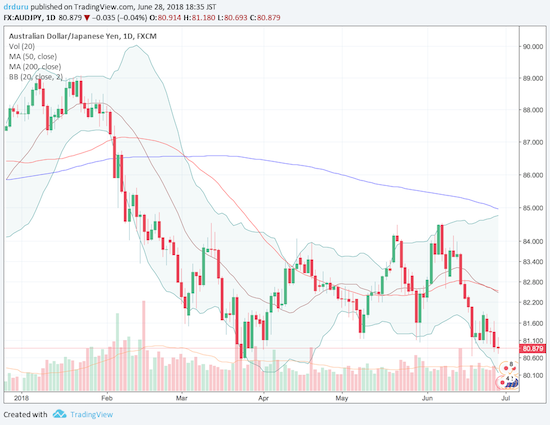
AUD/JPY has struggled for 4 months to regain momentum. It now looks ready to make a bearish break to a new major low.
Source: TradingView.com
CHART REVIEWS
Campbell Soup Company (CPB)
The week started with news that likely explained the strong post-earning recovery and run-up for CPB. Rumors swirled that the Kraft Heinz Company (KHC) is interested in acquiring CPB. Now it could be sell the news time as CPB works its way back into Monday’s gap. I decided to make a large hedged play on this move with a long-term call spread and short-term puts. If the rumor proves untrue, CPB could quickly reverse most of its post-earnings recovery. If the rumor turns out to be true, I am assuming we may not know for months and that the acquiring company will pay at least $43.
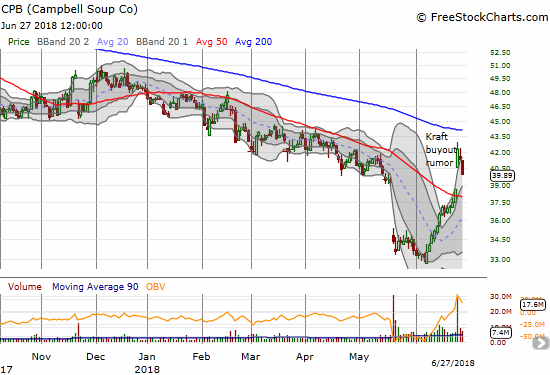
Campbell Soup Company (CPB) lost 3.4% and looks ready to fill Monday’s big gap up.
iShares MSCI Emerging Markets ETF (EEM)
EEM struggled with its 200DMA through most of May. In June, EEM confirmed 200DMA resistance in dramatic fashion. EEM is reaching for a 52-week low on the heels of three straight weeks of selling.
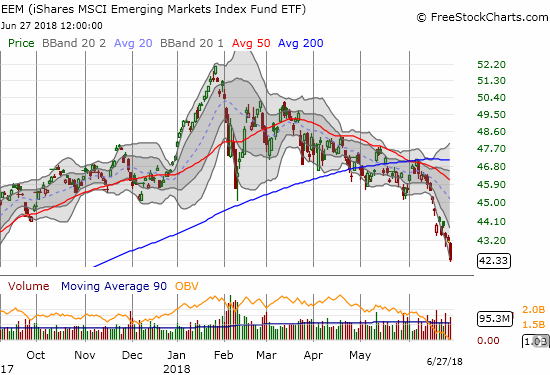
The iShares MSCI Emerging Markets ETF (EEM) closed at an 11-month low as emerging markets take the largest hit over trade war fears and a slowing of global growth.
Lennar (LEN)
LEN could have been the last stand for home builders. The stock ALMOST delivered. Ahead of earnings, the stock plunged, and I could not resist speculating on another post-earnings pop.
Took total flyer on $LEN call options. Over-extended pre-earnings. If LEN can't turn sentiment, housing, $ITB r confirmed toast for summer. pic.twitter.com/FgwC9BTuGk
— Dr. Duru (@DrDuru) June 25, 2018
The trade worked, but I had to quickly sell. LEN started into a fade right from the post-earnings open. The stock briefly recovered only to succumb to sellers all over again. The sellers returned to fade another gap up. The trading volume on the selling is high which likely telegraphs ever lower prices for LEN. As long as sentiment stays so poor on home builders even as they continue to tell good earnings stories, I remain particularly wary about the entire stock market and even the economy. I cannot imagine the stock market confirming a strong economy at some point in the near future while leaving home builders behind.
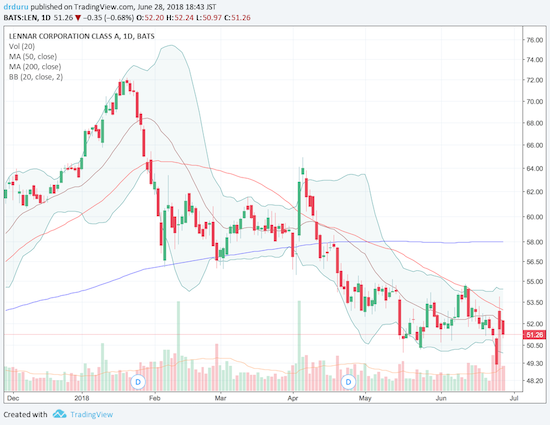
Lennar (LEN) is feeling the weight of another post-earnings fade as it struggles to stay away from a fresh 16-month low.
Source: TradingView.com
Netflix (NFLX)
NFLX is one of the most visible trade war “safety” trades. NFLX gapped up over the $400 level last week. On Monday, NFLX gapped back below $400. The resulting pattern is the dreaded abandoned baby top where buyers who chased the gap up are left stranded. NFLX can only invalidate this bearish pattern with a new all-time high. I am now on my second tranche of a short position (calendar put spread).
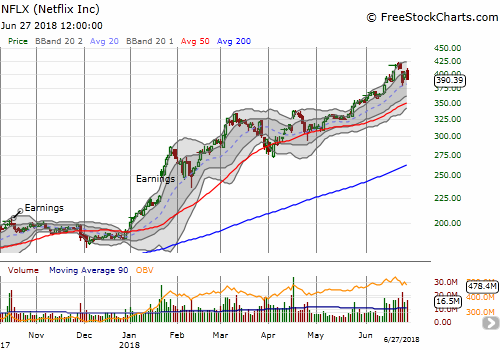
The Monday gap down for Netflix (NFLX) left behind a 3-day abandoned baby top. NFLX has topped until proven otherwise with a new closing all-time high.
Red Hat (RHT)
Last week I labeled RHT a broken stock. This week, RHT confirmed the label by a bearish 200DMA breakdown.
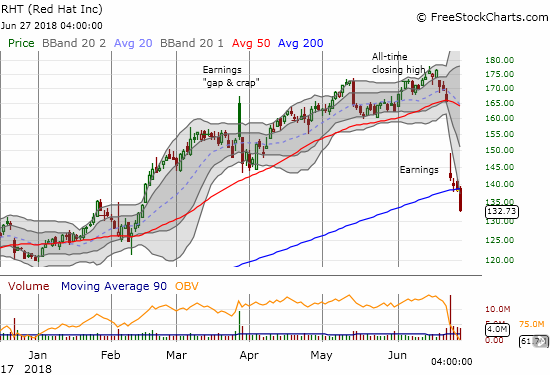
The troubles for Red Hat (RHT) grew as sellers continue to dump stock in high volume. Yesterday's 4.1% plunge took the stock well below its 200DMA, a position RHT has not occupied since early 2017.
Thor Industries (THO) and Winnebago Industries (WGO)
THO CEO Bob Martin came on Mad Money to talk his company’s praises. Cramer did his best to subtly dig into the company’s presumed problems that have weighed the stock down. A few days later the stock gapped up ahead of earnings of competitor Winnebago Industries (WGO), but it sold off on the news. Now, THO has reversed all the latest enthusiasm. If I go long, I will look to do so after the next 50DMA breakout.
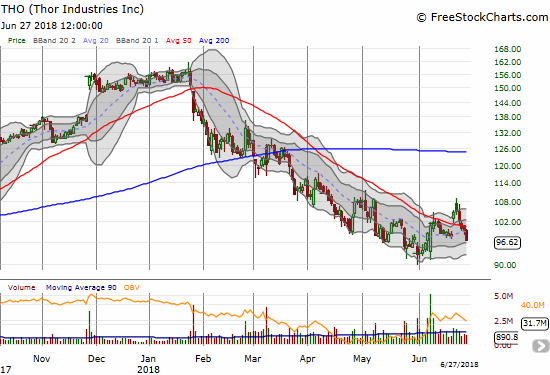
Thor Industries (THO) looked hopeful for a hot minute after a large post-earnings gain. Yesterday’s 2.7% loss finished a post-earnings reversal.
Video Length: 00:07:54
CEO of country’s largest RV maker says company is finding ways to ‘counteract’ tariff pressures from CNBC.
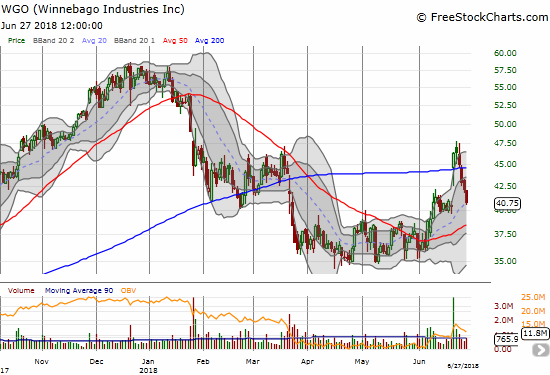
Like THO, Winnebago Industries (WGO) closed what was a very hopeful gap up. WGO’s 200DMa breakout is now a fakeout, but the stock still has a chance to reconfirm a bottom with a successful test of rising 50DMA support.
US Concrete (USCR)
USCR might as well be “Ugh – Something Can’t (Be) Right.” The chart says it all. Sellers have mercilessly descended upon the stock again. It closed yesterday at a 19-month low.
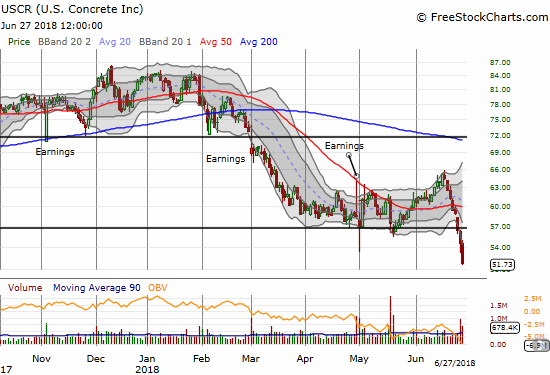
US Concrete (USCR) is now one of my more disappointing longer-term positions. Sellers have ravaged USCR for 8 straight days with high volume. The stock closed yesterday at a 19-month low.
Wynn Resorts (WYNN)
WYNN has been a stock full of drama. I was surprised at how readily the market seemed to grab a hold of the narrative that a buyer would show up and take WYNN out after CEO Steve Wynn stepped down amid the weight of allegations of personal misconduct. A new narrative has taken over and reversed the stock back to its February consolidation range and a 200DMA breakdown. I suspect that what ails China, also ails WYNN.
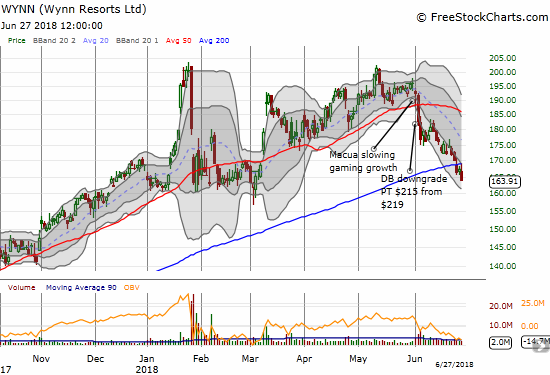
Wynn Resorts (WYNN) has gone from an impressive post-Steve Wynn recovery to a bearish 200DMA breakdown.
“Above the 40” uses the percentage of stocks trading above their respective 40-day moving averages (DMAs) to assess the technical health of the stock market and to identify extremes in market sentiment that are likely to reverse. Abbreviated as AT40, Above the 40 is an alternative label for “T2108” which was created by Worden. Learn more about T2108 on my T2108 Resource Page. AT200, or T2107, measures the percentage of stocks trading above their respective 200DMAs.
Active AT40 (T2108) periods: Day #91 over 20%, Day #60 over 30%, Day #55 over 40% (overperiod), Day #1 under 50% (underperiod), Day #3 under 60%, Day #11 under 70%
Daily AT40 (T2108)

Black line: AT40 (T2108) (% measured on the right)
Red line: Overbought threshold (70%); Blue line: Oversold threshold (20%)
Weekly AT40 (T2108)

Disclosure: Long USCR, long NFLX calendar put spread, short AUD/JPY, long CPB call spread and puts.
Follow Dr. Duru’s commentary on financial markets via more


