
Above The 40 – No Follow-Through For The S&P 500’s Reflex Bounce
AT40 = 38.6% of stocks are trading above their respective 40-day moving averages (DMAs)
AT200 = 48.0% of stocks are trading above their respective 200DMAs
VIX = 11.3
Short-term Trading Call: neutral
Commentary
The S&P 500 (SPY) is suddenly struggling at its 50-day moving average (DMA). The big reflex bounce from Tuesday, August 22nd has yet to receive confirmation. On Friday, the index faded from resistance.
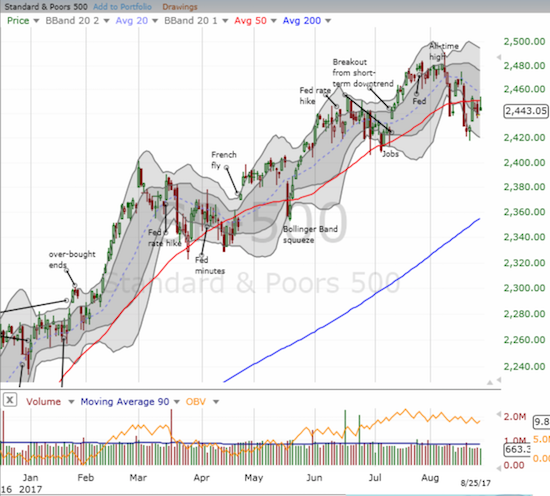
Time is ticking on the S&P 500 as its 20DMA declines into its struggles with 50DMA resistance.
Interestingly, the Nasdaq is struggling with its 50DMA as a pivot while the PowerShares QQQ Trust (QQQ) is bouncing on top of its 50DMA like support and under its downtrending 20DMA as resistance.
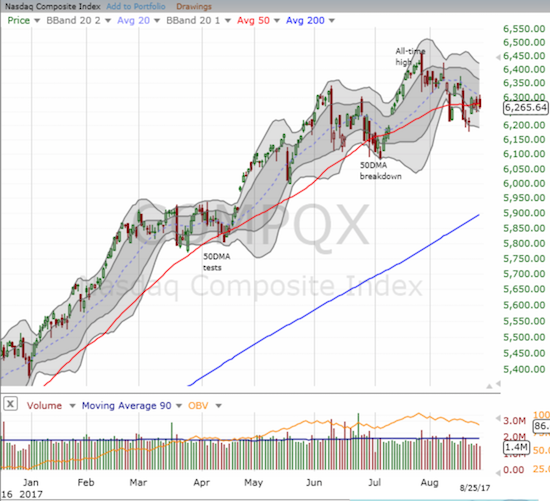
The Nasdaq is pivoting around its 50DMA.
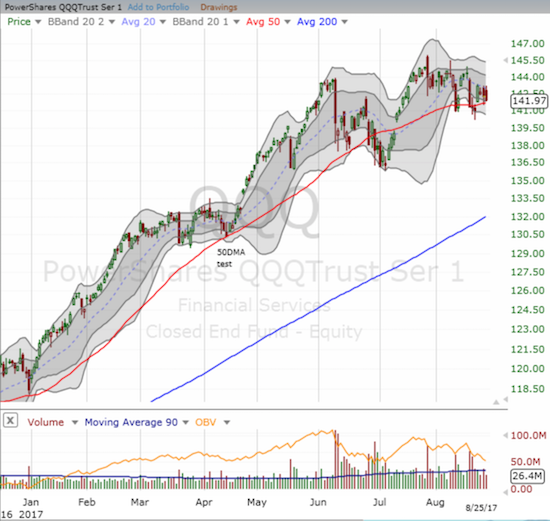
The PowerShares QQQ Trust has found plenty of support at its 50DMA throughout August.
In these fuzzy situations, AT40 (T2108), the percentage of stocks trading above their respective 40DMAs, can provide a deciding insight. My favorite technical indicator was a clear bullish sign as it bounced from “close enough” to oversold levels in the low 30%s and avoided a daily loss the entire week. AT40 even at one time nearly reversed its entire loss from the big plunge on August 17th. Still, my short-term trading call stays at neutral as I await definitive confirmation from the S&P 500 with a close above 2,475 (the peak of a topping pattern).
Along with the neutral call comes my hedges in the form of call options on ProShares Ultra VIX Short-Term Futures ETF (UVXY) and put options on ProShares Short VIX Short-Term Futures ETF (SVXY). Both are wasting assets as the volatility index (VIX) rapidly returned to extremely low levels. The VIX closed at 11.3 and confirmed a complete reversal of the North Korea fears from August 10th.
With concerns over North Korea returning to the background, the market may next choose to worry about the growing potential of a government shutdown. I am very skeptical of this latest political drama: the scene seems draped in a big bluff. President Donald Trump simply needs to demonstrate to his base that Congress blocked his effort to build a wall at the U.S.-Mexican border (nevermind that the President’s latest threats would force U.S. taxpayers and not Mexico to pay for the wall). As a result, I will be looking to fade any coming VIX spikes driven by headlines of a government shutdown.
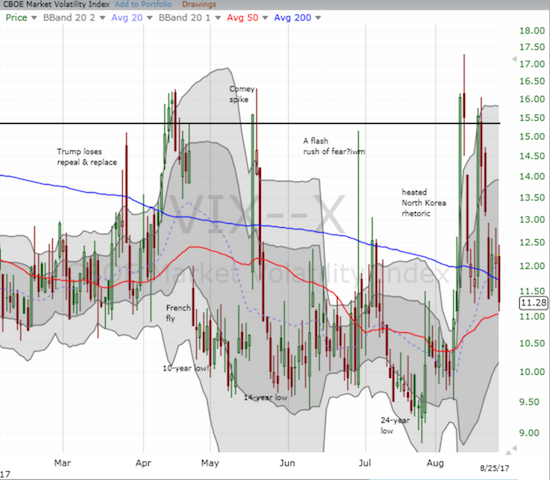
The volatility index has completed yet another full reversal from a brief bout of market hand-wringing.
Caterpillar (CAT)
CAT is on the edge of throwing its hat into the ring of bullish confirmation. The stock rests directly below an all-time high. On August 22, CAT came short of the all-time closing high set on February 23, 2012 by a mere 28 cents. To close the week, CAT’s intraday high broke through the all-time high but sellers refused to leave CAT to bask in all-time high glory. Although the fade makes CAT look a bit toppy, the current Bollinger Band (BB) squeeze has resolved to the upside. I would normally look to buy a new all-time high, but I may need CAT for a hedge against bullishness during this seasonally weak period for stocks. I will definitely short CAT upon a close below the current trading range.
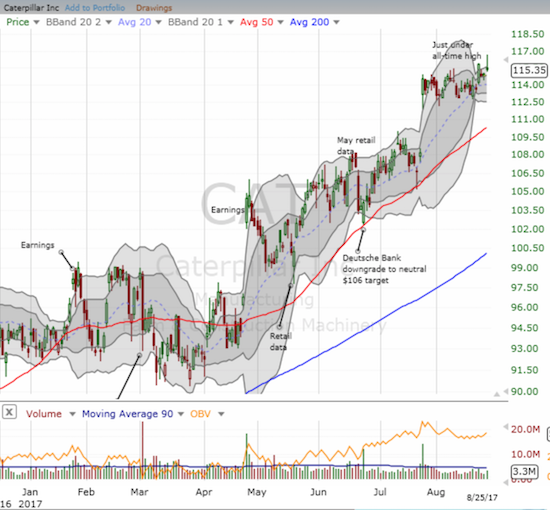
Caterpillar is on the verge of a major move: a freshly bullish breakout to an all-time high…or a major failure with the all-time high as resistance.
Ulta Beauty (ULTA)
I have posted several warnings about ULTA in previous posts: I concluded that traders and investors were eagerly exiting the stock. Given the expense of options going into earnings, I did not make another short-term bearish bet (I also missed a great fade on the last day of trading before earnings!). I just watched as ULTA cratered to a 9.1% loss. I then turned around and speculated on a call option for a quick bounce given the plunge well below the lower-Bollinger Band (BB).
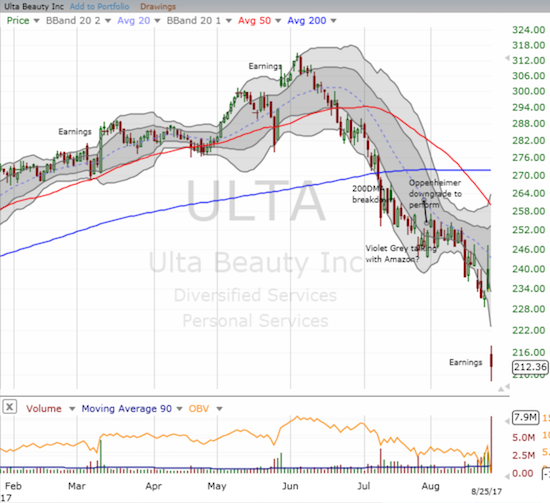
Ulta Beauty took a post-earnings dive that closed a post-earnings gap UP form May, 2016 (not shown).
Surprisingly, short interest is only 4.6% of ULTA’s float. That percentage could rise substantially as the shares short hit a high as ULTA hit an all-time high. Bears have yet to relent since then.
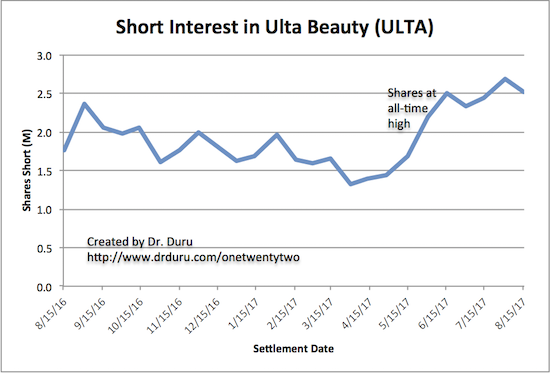
The waning bearish interest in Ulta Beauty ended sharply in May and June of 2017.
Source: NASDAQ
The Amazon Panic
The on-going “Amazon Panic” deserves its own section. Last week, Amazon.com (AMZN) closed its deal to buy Whole Foods Market (WFM). The reaction in the market was surprisingly harsh – as if traders and investors were harboring hopes that the deal would get scuttled. All the usual suspects reacted. EVEN Impinj (PI) popped – a stock I am glad I was skeptical of buying at the time it first popped on the AMZN news. I DID finally buy following a disastrous market reaction to the last earnings report; I also accumulated more shares as the selling continued. I was dismayed until the deal closing sent PI soaring. I also took advantage of this latest AMZN panic to jump back in call options on Target (TGT). An order to buy fresh call options on Kroger (KR) failed to fill, but I will line up more Amazon Panic buys for next week.
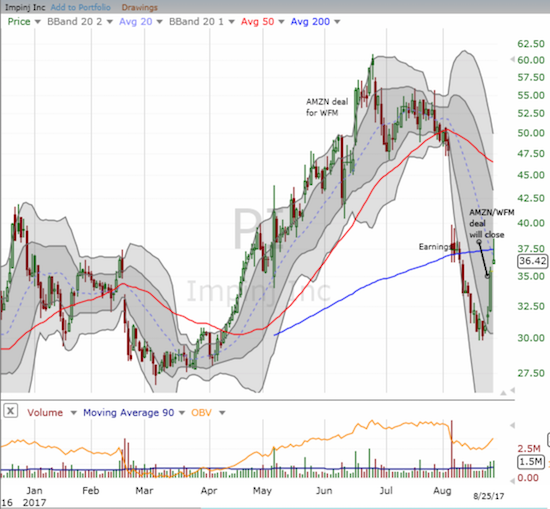
Impinj came back to life thanks to Amazon.com but sellers knocked PI back down below 200DMA resistance.
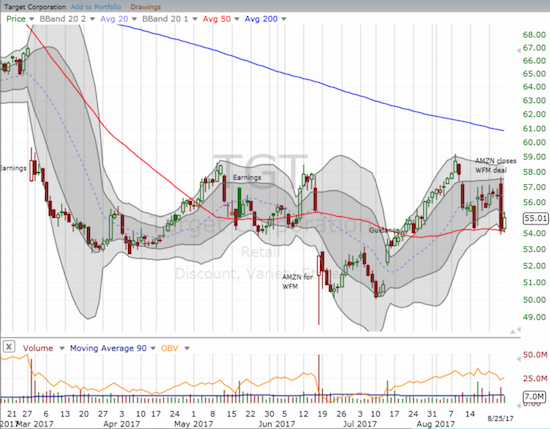
For Target, the Amazon Panic selling on Target came to a hard stop at 50DMA support.
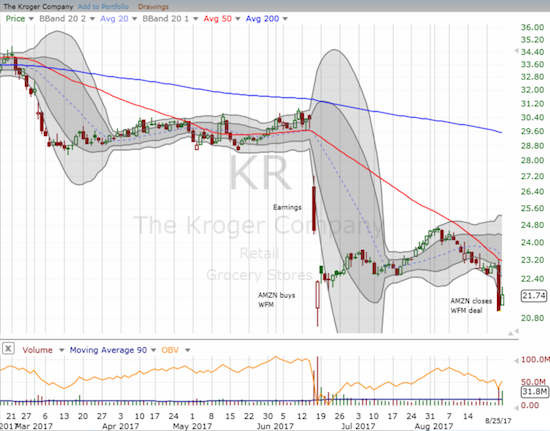
The Kroger Company suffered mightily from the latest Amazon Panic as it closed at a fresh 17 month low. KR also confirmed 50DMA resistance.
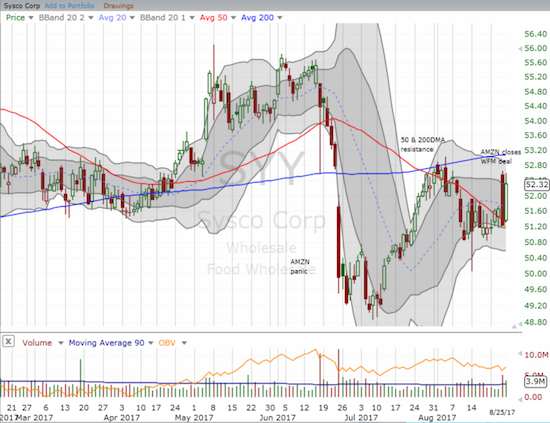
Sysco Corp (SYY) actually gapped up to open the day before sellers closed the stock right below 50DMA support. Buyers returned in force the next day.
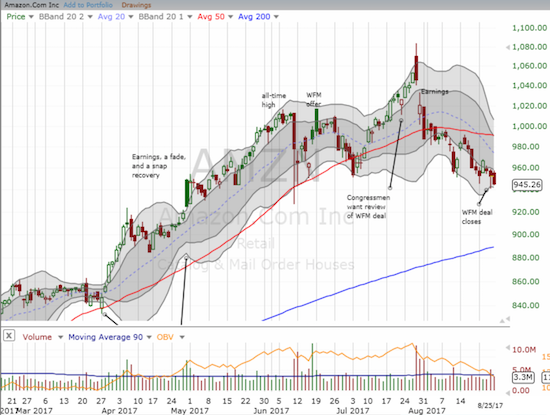
This time, Amazon. com did not benefit from the Amazon Panic as it closed down on the day news broke on its deal for Whole Foods Market. Sellers returned the next day as part of a broader 50DMA breakdown.
Snap Back?
I have not talked about Snap, Inc. (SNAP) in a long time. I essentially ended my bearishness on SNAP as it approached its IPO price. I just assumed that the market would buy and hold that line as support. I even thought that the company would correct its mistakes from the last earnings report. Strike one and strike two. YET, SNAP looks like it finally bottomed. The day after earnings, SNAP printed a powerful bullish engulfing pattern. It shot up like a rocket from there until it hit 50DMA resistance. If SNAP can close above that resistance, it should return to $17 in relatively short order. Note that sentiment on StockTwits on SNAP is now 58% bullish. Short interest weighs heavy on SNAP: 17.8% of float.
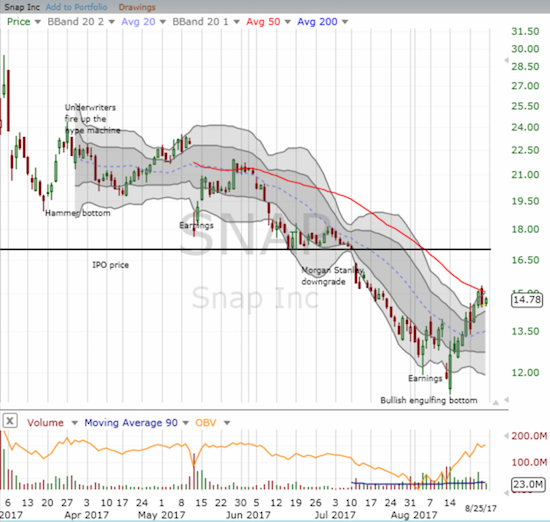
Snap, Inc. rebounded sharply from its latest woes in a pattern that looks like a definitive bottom. Resistance at the 50DMA held firm however.
Active AT40 (T2108) periods: Day #385 over 20%, Day #199 over 30%, Day #7 under 40% (underperiod), Day #16 under 50%, Day #22 under 60%, Day #145 under 70%
Daily AT40 (T2108)

Black line: AT40 (T2108) (% measured on the right)
Red line: Overbought threshold (70%); Blue line: Oversold threshold (20%)
Weekly AT40 (T2108)

*
All charts created using freestockcharts.com unless otherwise stated
Full disclosure: short put options on SYY and KR, long PI, long SNAP, long UVXY calls, long SVXY puts, long ULTA call
*Charting notes: FreeStockCharts.com uses midnight U.S. Eastern time as the close for currencies.
Disclosure: short put options on SYY and KR, long PI, long SNAP, long UVXY calls, long SVXY puts, long ULTA call
Follow Dr. Duru’s commentary on financial markets via more


