
Above The 40 – Another Missile, Another All-Time High For The S&P 500
AT40 = 60.4% of stocks are trading above their respective 40-day moving averages (DMAs)
AT200 = 53.2% of stocks are trading above their respective 200DMAs
VIX = 10.2
Short-term Trading Call: cautiously bullish
Commentary
North Korea launched another ballistic missile over Japan, this one with enough range to hit Guam. The general market response was a collective yawn. In an earlier post I claimed that further militaristic actions from North Korea were not likely to spook markets until/unless the U.S. (or some country) actually responded. That assessment rang true in this latest incident.
The S&P 500 (SPY) hit a fresh all-time high. On Monday of last week the index made a new all-time high and met my criteria for flipping the short-term trading call from neutral to cautiously bullish. On Tuesday, the S&P 500 confirmed the change in trading call with a higher close.
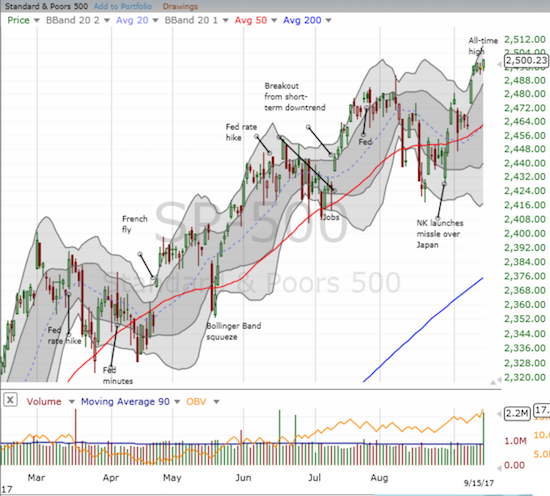
The S&P 500 (SPY) looks set up for more gains as it reaches higher into its upward trending Bollinger Band (BB) channel.
The Nasdaq and PowerShares QQQ ETF (QQQ) faded from their respective highs and just missed joining the S&P 500 in the all-time party.
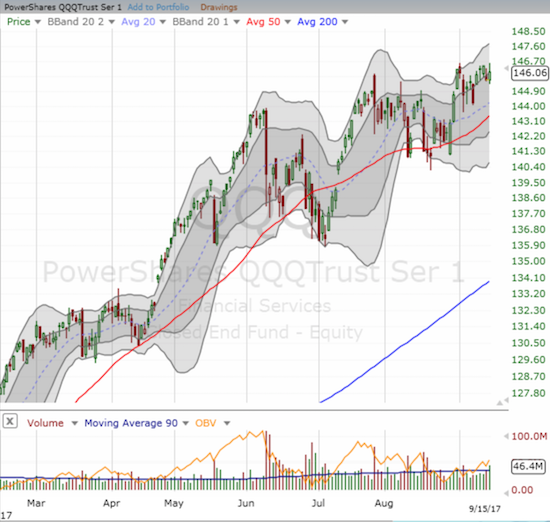
The PowerShares QQQ ETF (QQQ) faded off a new all-time high back into the month’s trading range.
AT40 (T2108), the percentage of stocks trading above their respective 40-day moving averages (DMAs), is still confirming the bullish mood. AT40 closed the week at 60.4%, its highest close since July 27th. A fresh visit to the overbought threshold (70%) appears imminent. Unlike past approaches in recent times, this run has a very bullish implications. A close into overbought territory will likely mark the beginning of a strong, overbought rally. This seasonally weak period for stocks continues to surprise!
The volatility index, the VIX, is a full participant in the surprise. I have been targeting September as the month when the period of extremely low volatility came to a definitive end. Instead, the VIX finds itself plunging right back to extremely low levels (below 11). Sure the past month has featured at least 4 separate VIX spikes (depending on how you want to count), but the current drop to 10.2 serves as a reminder that nothing has happened to create any sustained level of concern in the market.
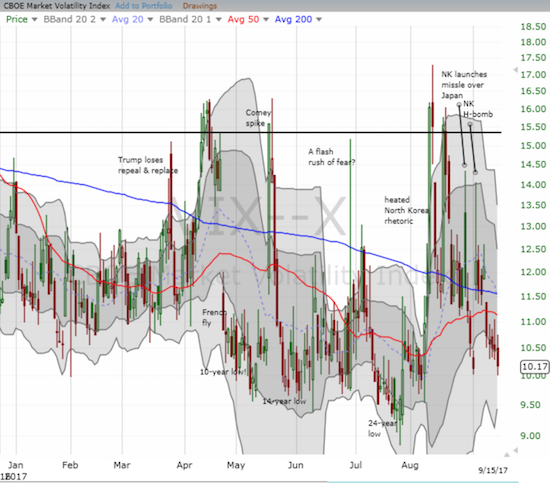
The volatility index (the VIX) finds itself right back at extremely low levels after multiple rejections from higher levels including twice from the 15.35 pivot.
The financials have yet to confirm the bullish sentiment in the market. The Financial Select Sector SPDR ETF (XLF) has struggled mightily since the bullish breakout in late June/early July. An extension rally in August stopped short of confirming the bullish break from the previous head and shoulders pattern. XLF sold off from there right back to the February breakout point. Like clockwork, traders bought the test of support and now XLF is struggling to break through 50DMA resistance. I have not made a trade on XLF in a while, but I have put it back on the radar.
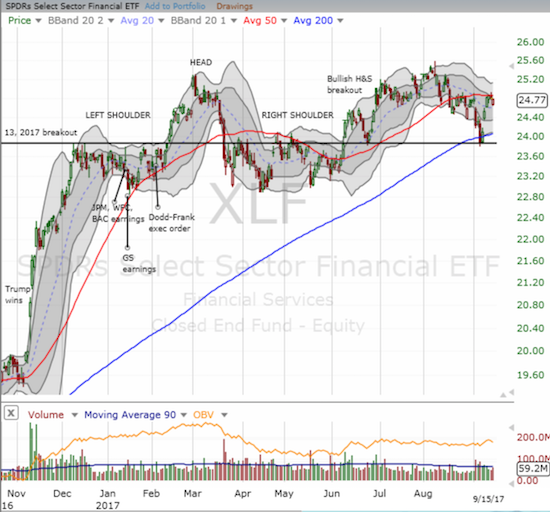
The Financial Select Sector SPDR ETF (XLF) has effectively spent most of 2017 churning around.
Apple (AAPL) has effectively churned since its bullish post-earnings breakout in early August. Yet, the rhythm has been good enough to deliver gains on the weekly call option trade. In the previous week, sellers delivered as expected by taking AAPL down after its product announcements. I started into my weekly call purchase on Thursday, but took profits on Friday’s pop. I recognize that there are times the market will attempt to get ahead of the typical Monday pop in AAPL.
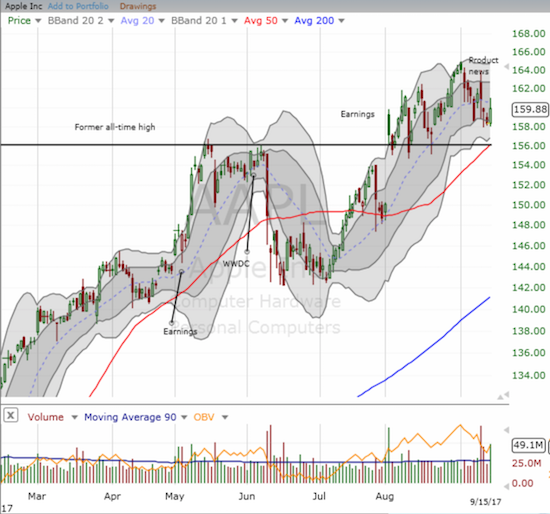
Taking a step back, I recognize that AAPL has essentially churned above its former all-time high. I daresay a test of converged support from the uptrending 50DMA and the former all-time high is imminent.
Retailers have been sneaking back. I suppose traders and investors are sniffing around for bargains in a market rally that “feels” very mature. For example, I have been carefully watching the auto parts retailers for a new opportunity to make a buy. The small positives seem to be building. O’reilly Automotive (ORLY) initiated a buyback after its last earnings. Last week, ORLY neatly bounced off 50DMA support. Autozone (AZO) broke through 50DMA resistance this month and continued to rally to a higher high. Combine that move with a higher low in August and a complete reversal of the loss in sympathy with ORLY, and AZO looks like it is bottoming. If AZO produces positive earnings before the market open on September 19th, I become a buyer.
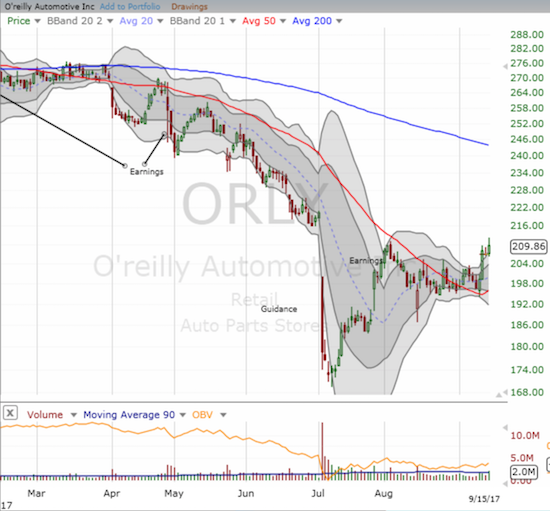
O’Reilly Automotive, Inc. (ORLY) is on the verge of confirming a bullish test of 50DMA support.
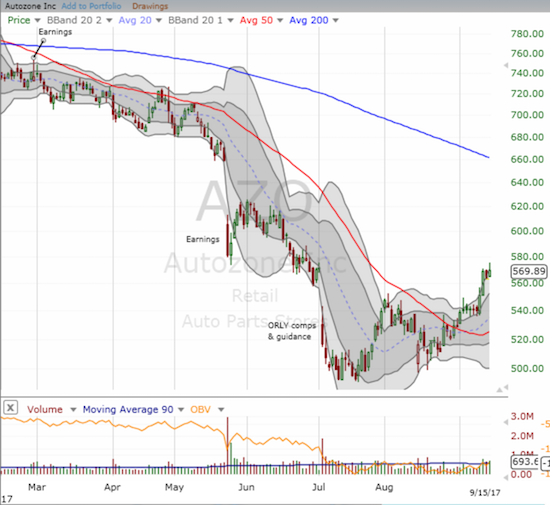
Autozone (AZO) is forming a bottoming pattern with a higher low and higher high that includes a 50DMA breakout.
Best Buy (BBY) is making a valiant comeback from a huge post-earnings breakdown. BBY reversed its entire incremental post-earnings loss with a 50DMA breakout. This is a great spot for a hedged play as the stock is poised for a major setback or the continuation of a gap fill play. I own calls and puts.
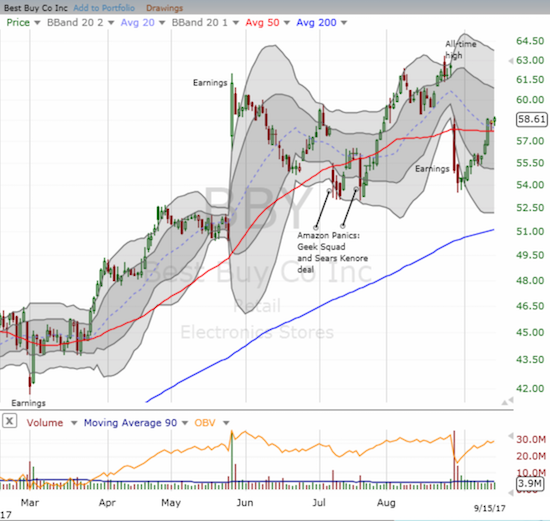
Best Buy (BBY) buyers have returned in force. Do they have enough gas to continue into a gap fill play?
The saga with Chipotle Mexican Grill (CMG) continues apace. A downgrade caused a huge gap down on CMG on September 8th, but buyers stepped in to keep CMG from setting a lower low. At one point last week, the gap even filled. These are the VERY faint signs of the start of a bottoming process for CMG. When I make a short-term trade on CMG, I am sticking with the long side. I am not yet ready to make another try on investing in a bottom.
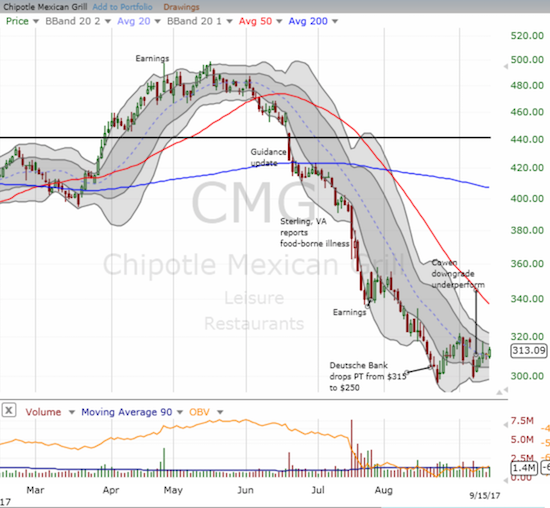
Chipotle Mexican Grill (CMG) is fighting to overcome two damaging downgrades.
First Solar (FSLR) is exceeding my most optimistic expectations. I long ago covered my short put for a profit. Now I wish I had loaded up on shares. An upgrade on Friday generated a breakout above recent congestion which confirmed a successful test of 50DMA support.
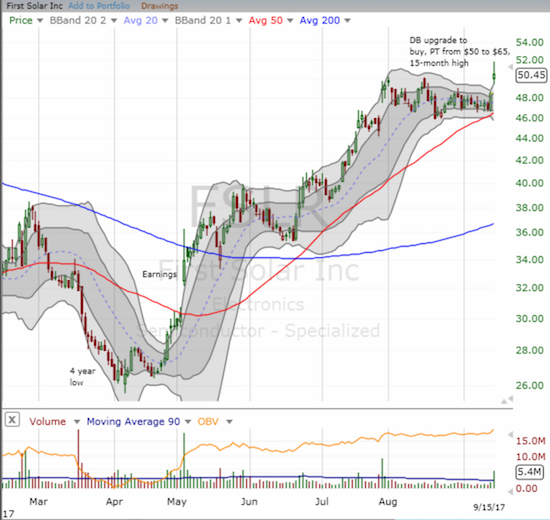
Another bullish breakout for First Solar (FSLR)
A much more speculative, but near similar breakout, comes from Zynga (ZNGA). Remember them? While I focused on improving my Words with Friends skills, ZNGA quietly rallied from near-death below the $2 barrier in early 2016. Now, ZNGA sits at 40-month highs and a bullish breakout from an extended trading range. I like buying right here with a potential stop below the trading range with risk down to a test of uptrending 200DMA support. Given this is a speculative play, it makes sense to keep the trading size small and widen the window for trading.
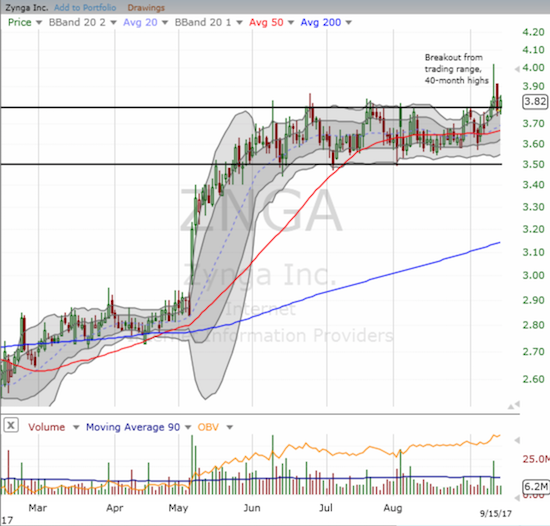
Zynga (ZNGA) made a classically bullish breakout with high volume above a tight and extended consolidation range.
U.S. Concrete (USCR) continues to intrigue. I have written several articles on USCR already. Here, I just want to point out that on Friday, USCR printed a picture-perfect bounce from 200DMA support. I tried to double down on my position here, but my limit order failed to trigger.
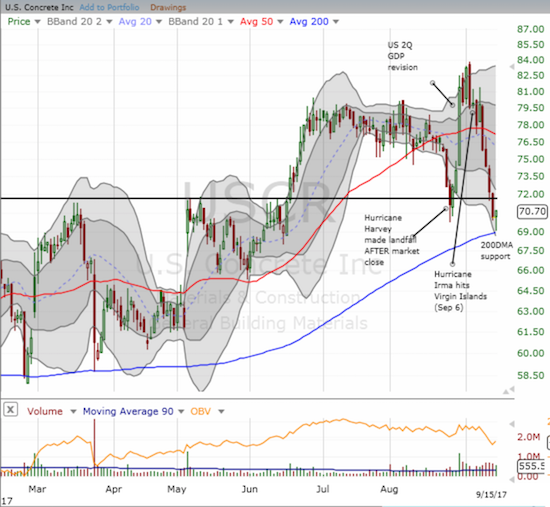
U.S. Concrete (USCR) stemmed the recent loss with a picture-perfect bounce from 200DMA support on strong volume.
I end this tour of notable stock charts with the iShares Nasdaq Biotechnology ETF (IBB). IBB bounced strongly off the last low but met stiff resistance at an important milestone: the Clinton bash. When I wrote about the Clinton bash two years ago, I staked a claim on an eventual recovery. However, I did not have a two-year horizon for that recovery! Buyers are struggling to complete the recovery as IBB has failed all month to get through resistance. Now, IBB is very vulnerable to a fresh bash from somewhere in the U.S. political apparatus. Stay tuned!
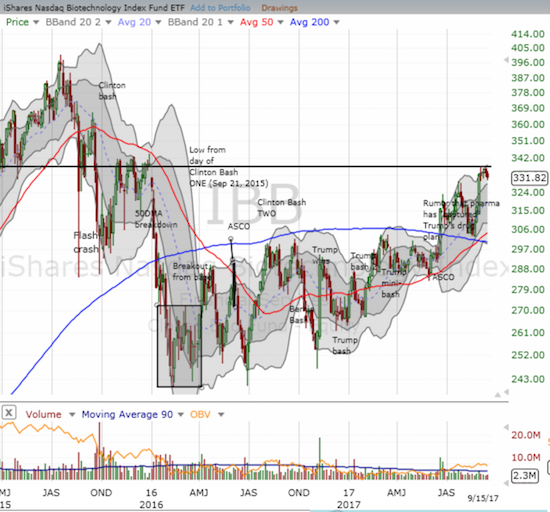
This 3-day chart provides a view into the origin of September’s month-long resistance for the iShares Nasdaq Biotechnology ETF (IBB).
“Above the 40” uses the percentage of stocks trading above their respective 40-day moving averages (DMAs) to assess the technical health of the stock market and to identify extremes in market sentiment that are likely to reverse. Abbreviated as AT40, Above the 40 is an alternative label for “T2108” which was created by Worden. Learn more about T2108 on my T2108 Resource Page. AT200, or T2107, measures the percentage of stocks trading above their respective 200DMAs.
Active AT40 (T2108) periods: Day #392 over 20%, Day #206 over 30%, Day #6 over 40% (overperiod), Day #23 under 50% (underperiod), Day #29 under 60%, Day #152 under 70%
Daily AT40 (T2108)

Black line: AT40 (T2108) (% measured on the right)
Red line: Overbought threshold (70%); Blue line: Oversold threshold (20%)
Weekly AT40 (T2108)

* All charts created using freestockcharts.com unless otherwise stated
Be careful out there!
Disclosure: Long USCR calls, long UVXY call options
*Charting notes: FreeStockCharts.com uses midnight U.S. Eastern time as the close for currencies. Stock prices are not adjusted for ...
more

