
A Trading Week Headlined By Midterm Elections: Volatility Anybody?
Before I get right to the heart of the matter, as we look forward to the coming week that promises to be an eventful one as it includes midterm elections, let's take a look back at the latest auto sales. For all the fears and consternation thrown about in the media and by analysts and economists alike, I felt it would be noteworthy given the latest U.S. auto sales reported.
U.S. Auto Sales
October auto sales came on the heels of a good showing in September, when hurricane-related replacement sales and Labor Day deals pushed sales higher. Based on reported results so far, October’s seasonally adjusted annual rate is tracking at 17.8 million to 18 million vehicles sold, analysts at Consumer Edge Research said. That would contrast with estimates of a seasonally adjusted rate of around 17.5 million for most auto-sales forecasters and a SAAR of 18.5 million in September.
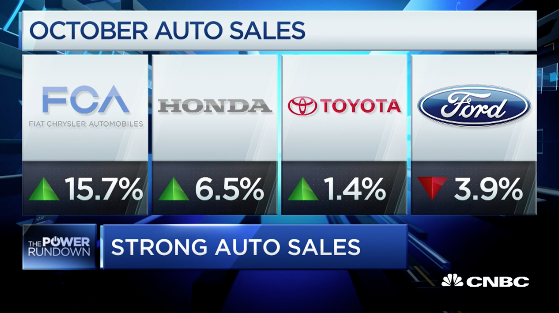
Sales may not compare to last month’s “breakout” performance, but sales above 17 million for October would still be a milestone and mark just the fifth time the industry has reached that number. Here is what Jonathan Smoke, chief economist at Cox Automotive had to say about the latest auto sales data:
“Incentives, including numerous lease pull-ahead offers, are pulling in consumers who are feeling confident about the economy and the future,” he said. “The recent two-month trend is decidedly stronger than we’ve seen this year, and the improvement is not all explained by hurricane replacement demand.”
More importantly, even with the highest interest rate since 2009 of 6.2%, the rate is not keeping consumers away from buying autos. It’s just not happening as discussed in this video with CNBC’s Phil LeBeau.
S&P 500 Expected Move
October ended with a bang, but not before finding the S&P 500 (SPX) and Nasdaq (NDX) both falling into correction territory during the month. For the week that was, both the Dow (DJI) and the S&P 500 were up 2.4% and the Nasdaq advanced 2.7%, its first weekly gain since the end of September. Big tech earnings are now out of the way and unfortunately, most of FANG was found wanting for better guidance. Amazon (AMZN) and Alphabet (GOOGL) took it on the chin post-earnings, but have since bounced. Even in a tough tape on Friday, AMZN finished flat on the session, which may portend some “good tings to come Man”. (An attempt at a Caribbean accent).
Last week’s expected move for the S&P 500 was some $90 and we captured every bit of that move and then some. But on Friday, with the market literally ripping in both directions at certain points during the day, ultimately the SPX gravitated right back toward the expected move and fell within it.
(Click on image to enlarge)
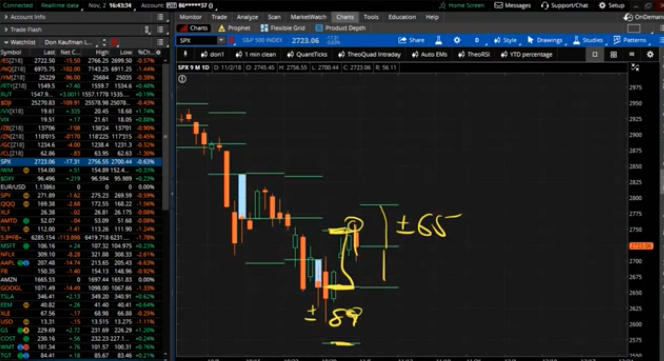
This coming week’s expected move is also lighter than that of the previous week at $65. With midterm elections on Tuesday, there is a greater possibility of the expected move being breached. When considering which end of the spectrum might be breached for the whole of the week, consider that buybacks are going to progressively increase with more than 60% of S&P 500 companies having reported already and the earnings picture is only accelerating to the upside.
Economic Data
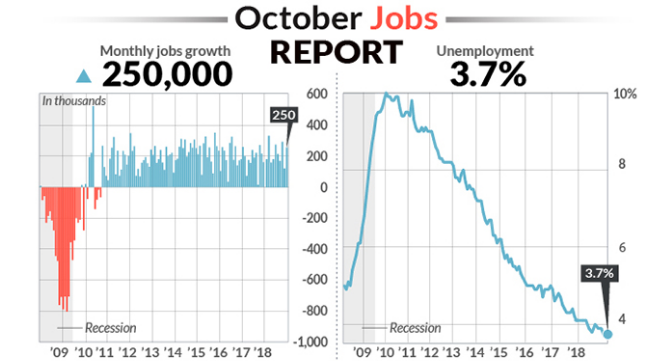
From jobless claims to productivity growth to Nonfarm Payrolls, the data has been spectacular right? Headline alert, headline alert: The rapidly growing economy generated a sizzling 250,000 new jobs in October, keeping the unemployment rate at a 48-year low and pushing the increase in worker pay to the highest level in more than nine years. The headline NFP job growth number of 250,000 blew away economists expectations of roughly 190K or so. The amount of money the average employee earns rose 0.2% last month to $27.30 an hour, the government said Friday.
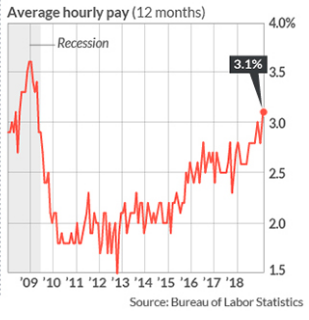
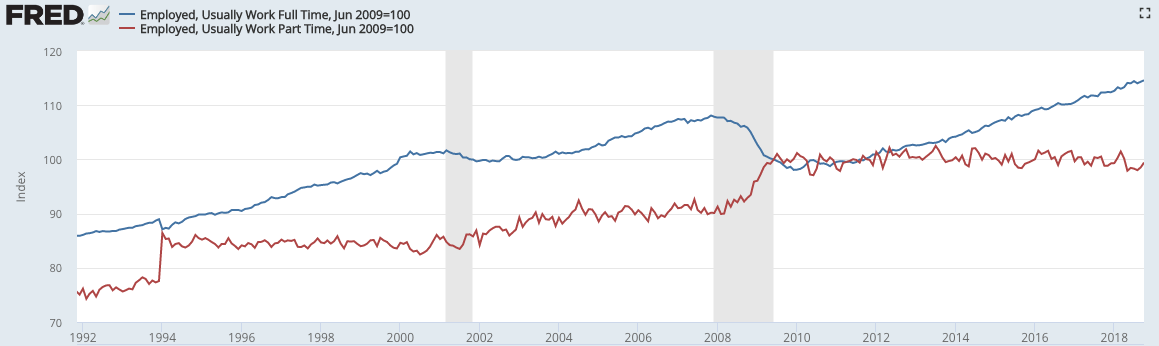
As shown in the chart above, the increase in pay over the past 12 months climbed to 3.1% from 2.8%, touching 3% for the first time since the end of the Great Recession in mid-2009. This is a positive trend, showing demand for more workers. Sustained acceleration in wages would be a big positive for consumption and investment that would further fuel employment. Moreover and as shown in the chart below, employment has been driven by full-time jobs, which rose to a new all-time high in October (blue line), not part-time jobs (red line). Full-time jobs tend to also come with lucrative benefit packages.
(Click on image to enlarge)
The U.S. has added an average of 213,000 jobs a month through the first 10 months of 2018, well above the 182,000 pace during the same period last year. Despite the fantastic labor market and rising wages, you’ll see some analysts promoting the idea of a looming recession.
Fed-Focus
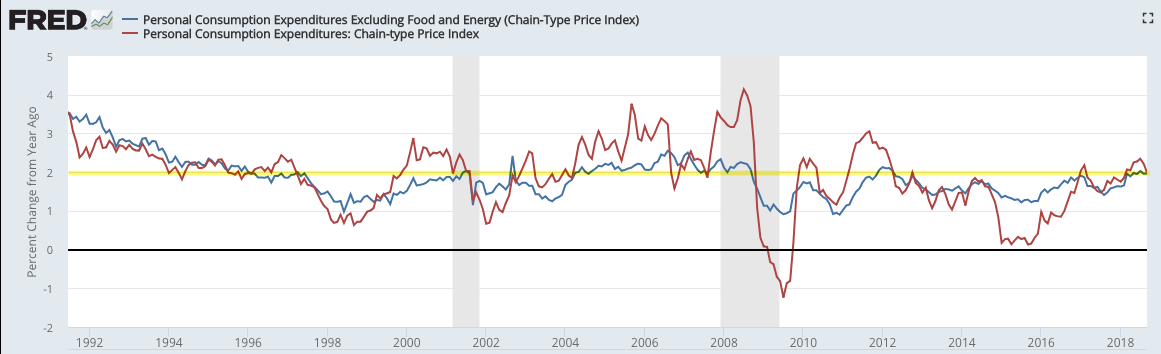
I fully expect the Fed to raise its Fed Funds rate by .25 bps points come the December 2018 2-day meeting. Whether or not it foreshadows a potential pause thereafter remains to be seen. Inflation remains in-check according to the latest preferred measure of inflation by the Fed, Personal Consumption and Expenditures. Total and core PCE were 2.0% and 2.0% YOY respectively, last month.
(Click on image to enlarge)
So while the market pundits and perma-bears cry afoul for the wage inflation currently trending, all that really does is offer the Fed validation for its CURRENT rate hike path. It doesn’t, however, exonerate the fact that inflation is not rampant, persistent or at breakaway speeds/levels. The Fed can and might still pause after December to see how rates shake out and how the economy performs coming out of 2018 and as it goes through Q1 2019. If the Fed’s true mandate is determined, in part, by inflation and it remains data-dependent, a pause may be warranted. As far as equity markets' performance near term and with the 10-year yield rallying last Friday, yes, equity investors still need to adjust risk as the market grapples with the 3.25% yield level. Here is what Hedge fund billionaire Paul Tudor Jones suggests with regards to the Fed and his market outlook.
"We're clearly going through a tightening cycle. At some point, they're going to stop. I think you'll have a chance to see the old highs revisited if and when and before we go into a bear market. I'm thinking through the end of the tightening cycle, the pause, the excitement around that pause, and then I think, boy, then you've got to pay attention. Then you've got to pay attention. We'll probably rally after whenever they finish [tightening].
Grappling With Volatility
October brought with it a 75% spike in the VIX or volatility. Fortunately, I had previously forecasted greater bouts of volatility were ahead of us, back in September. I raised ample cash in order to reduce the potential drawdowns from the short-VOL trade and added some positions as the VIX spiked. We still have the potential for bouts of volatility in early November, but expect the bulk of November to express a median VIX reading of roughly 15%, give or take .50 percent.
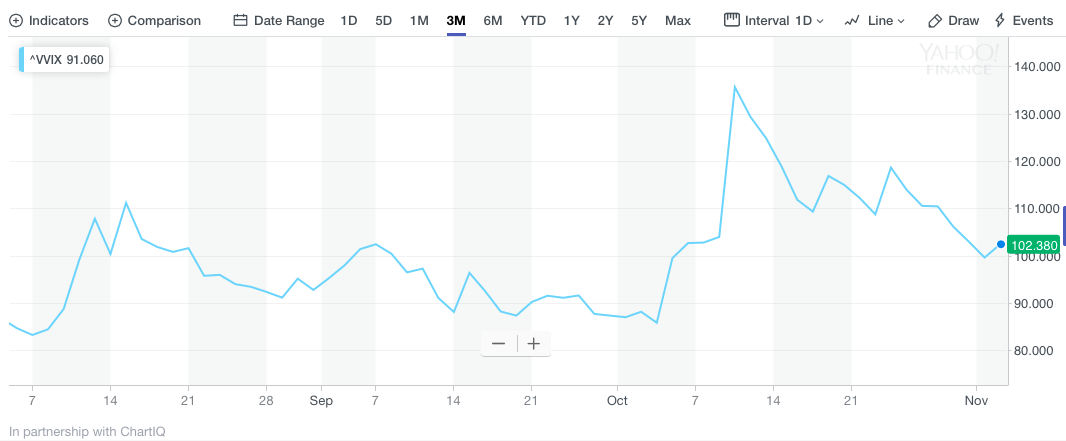
As it pertains to existing, elevated levels of market volatility, the Volatility of Volatility Index (VVIX) has declined greatly in the last week or so. It now rests right around the 100 level, which is moderately elevated still.
(Click on image to enlarge)
As the VIX itself has declined from its recent highs of 28% to just under 20%, the VIX Futures Term Structure has also found backwardation curtailed. VIX Futures Term Structure can exist in two states of expression, contango and backwardation. When volatility is upward trending and elevated, which is a rarity, backwardation can persist as it has through much of October. For those unfamiliar with some of the definitions of backwardation, I'll provide the following bullet points:
- Backwardation does not occur frequently in the Volatility complex based on the natural order of market cyclicality being more predisposed to bullishness than bearishness.
- When the Spot Price of the underlying (VIX/VIX Cash) is greater than the Futures Price at a particular point in time, the situation is called ‘Backwardation’. So, if VIX is at 20 now and the futures price i.e., the price of the front-month futures contract on VIX is 19 today, VIX Futures term structure is said to be in backwardation. The spot and futures prices move the way they are supposed to, driven by demand-supply, news etc. but at the expiration of the contract, the futures price and the spot price are the same as futures converge onto the spot/cash price of VIX.
(Click on image to enlarge)
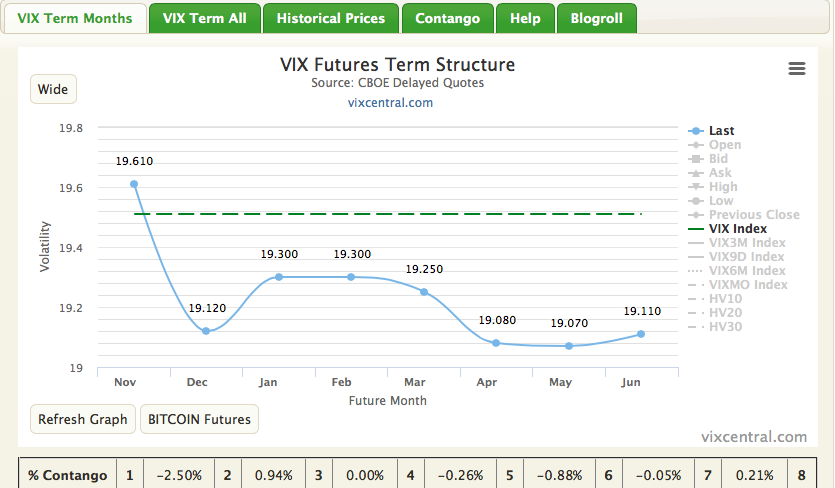
The screenshot above is the current state of the VIX Futures Term Structure with modest backwardation of -2.50% between the November VIX Futures contract (m1) and the December VIX Futures contract (m2). The main reason, the VIX Futures Term Structure (curve) looks as it does with November remaining stubbornly elevated is largely due to the belief that near-term volatility will be elevated versus the expectation of lesser volatility in the back months. Why? As mentioned previously, most participating interest in VIX Futures are forecasting greater volatility near-term due to the midterm elections in November.
Having said that, premium is coming out of elevated shorter-term volatility. In due course, the VIX Futures curve, which is in backwardation, should give way to contango in the coming weeks. As this happens, the cash VIX (19.51) comes under pressure.
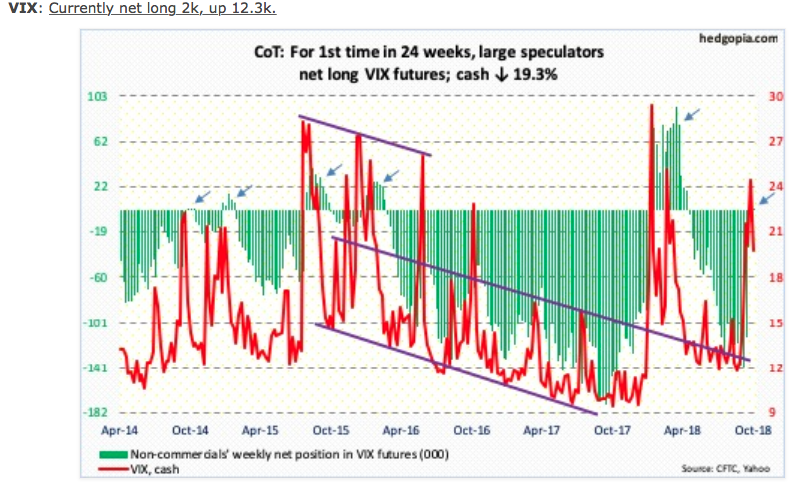
With this in mind, in this past week, non-commercials switched to net long VIX futures. Historically, this has coincided with a peak in the cash VIX price. That does not mean the VIX has peaked for the current bout of market volatility, but rather it has historically signaled the peak cycle of the market volatility is at-hand.
S&P 500 Earnings Season
I'm not sure how many times I’ve outlined that earnings forecasts would ratchet higher as the earnings season carried forward, but it is at least a dozen times. So with another week of earnings in our rear view mirrors, naturally, earnings forecasts have moved higher and sharply versus the prior week’s forecasts.
In our’s former forecast for Q3 S&P 500 earnings, we called for earnings growth of 22.5% YOY. In and of itself, that was a sharp move higher from 19.9% in the prior week. The most recently updated forecast now calls for Q3 earnings growth of 24.9 percent. If 24.9% is the actual growth rate for the quarter, it will mark the second highest earnings growth since Q3 2010. Keep in mind that retailers will start reporting come the back-end of November, and by all accounts, consumption and retail sales have been strengthening for much of the Q3 period and as reported by the Census Bureau.
For Q3 2018 (with 74% of the companies in the S&P 500 reporting actual results for the quarter), 78% of S&P 500 companies have reported a positive EPS surprise and 61% have reported a positive sales surprise. The forward 12-month P/E ratio for the S&P 500 is 15.6. This P/E ratio is below the 5-year average (16.4) but above the 10-year average (14.5).
Not only are earnings forecast moving higher, but the demand side of corporate results are also proving greater than analysts’ expectations. The blended, YOY sales growth rate for the third quarter is 8.5% today, which is above the estimate of 7.8% at the end of the quarter and higher than our’s former forecast of 7.6% sales growth. n terms of revenues, 61% of companies have reported actual sales above estimated sales and 39% have reported actual sales below estimated sales. The percentage of companies reporting sales above estimates is below the 1- year average (73%) but above the 5-year average (59%). In other words, the consumer is performing better than anticipated, even with respect to higher interest rates, something being demonstrated in auto sales and potentially to be demonstrated in new home sales in the future.
Thomson Reuters has also revised their Q3 S&P 500 earnings forecast as follows. Remember, Reuters has proven a better track record for which to model earnings, historically.
Aggregate Estimates and Revisions
- Third quarter earnings are expected to increase by 27.1% from Q3 2017. Excluding the energy sector, the earnings growth estimate declines to 23.8%.
- Of the 376 companies in the S&P 500 that have reported earnings to date for Q3 2018, 77.9% have reported earnings above analyst expectations. This is above the long-term average of 64% and above the average over the past four quarters of 77%.
- Third quarter revenue is expected to increase by 8.0% from Q3 2017. Excluding the energy sector, the revenue growth estimate declines to 6.9%.
No, your eyes are not fooling you! Reuters is now forecasting 27.1% Q3 earnings growth from the same period a year ago. These are powerfully strong forecast revisions ahead of both the healthcare and retail sector earnings period to come. Historically, markets follow earnings over time. While the market can adjust periodically to a number of factors and did so this past October, earnings have always been the main driver for equity markets.
Investor Takeaways
Discipline is key to long-term investing/trading success. It’s easier said than done, to maintain a discipline and/or stick to a previously outlined plan. When markets decline and seek out a full-scale correction, media headlines and coverage can play games with investor/trader emotions. It’s a powerful dichotomy of facts and opinions that the media pervades investors with during such periods. And everyone has an opinion on where the market is going, always! It’s for this reason that we implore traders to perform weekly due diligence and remain focused on the earnings picture. Could there come a time where the trajectory of earnings fails to drive the market? No, not really as the market constructs simply don’t permit such a divergence over time. Time is the key word, investors/traders are invited to manage their activity with that variable front of mind. With that being said, there is absolutely nothing wrong with actively managing positions through a market correction, assuming the actions aren’t emotionally driven. Take solace in the history of market performance that is spirited and largely a reaction to or expression of corporate earnings.


