
A Time For Consolidation Is At Hand
Gold
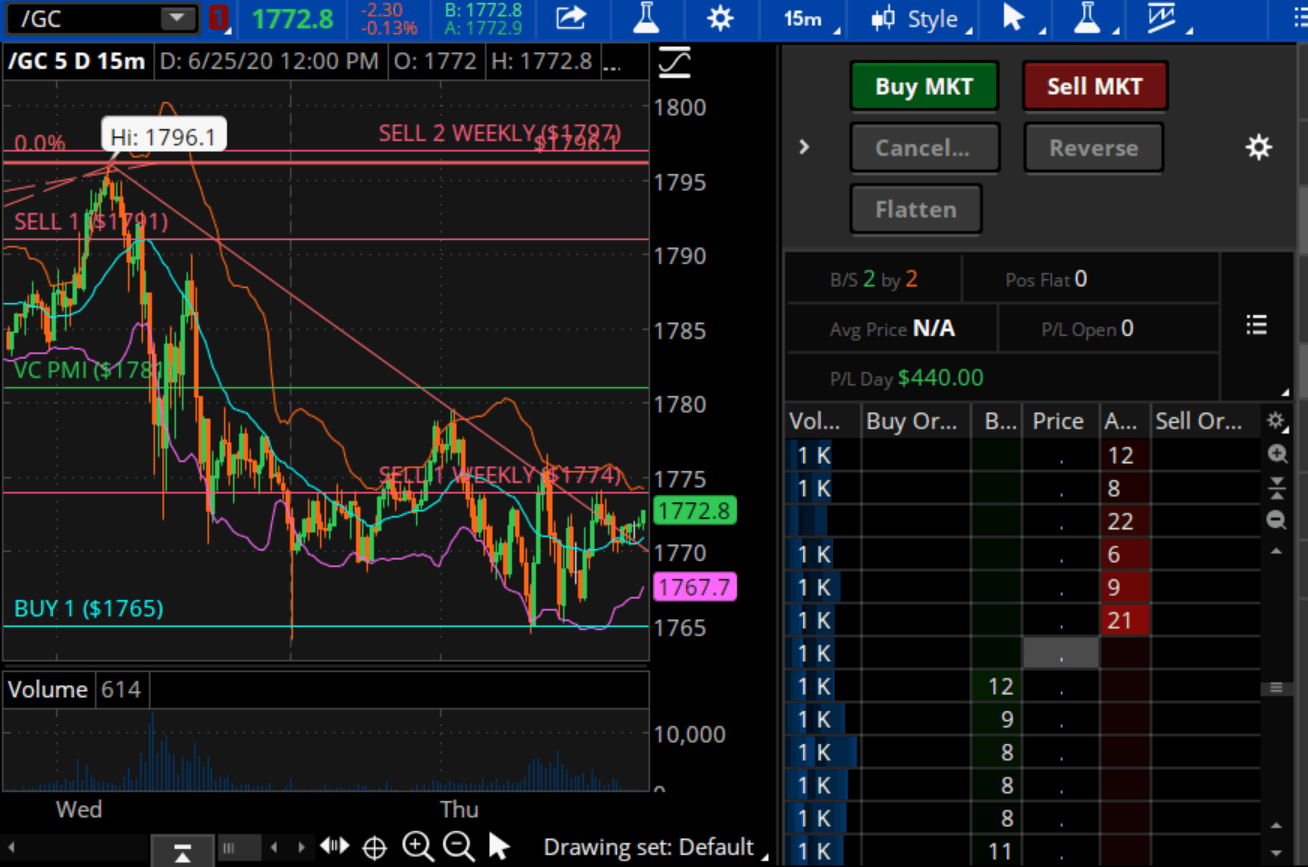
Gold was last at $1768.60, down about $6.50. Our day trading target is usually $300. We went short this morning from $1774, the weekly short trigger, and booked the profit. The signal is based on the Variable Changing Price Momentum Indicator (VC PMI), which is our proprietary artificial intelligence algorithm. The VC PMI uses reversion to the mean, Fibonacci levels and Vedic mathematics. We provide daily, weekly, monthly and annual reports to our subscribers with specific buy and sell levels based on the mean. It takes emotion out of your trading and lets you rely on the algorithm’s mathematical calculations. This is not a perfect system, but it has a strong track record.
(Click on image to enlarge)
(Courtesy: TD Ameritrade)
Last night, we told our subscribers that if the price goes down to $1765, we expect the market to go back up to $1780. The market came right into that $1765 level and then reverted right back up when it found buyers.
Limiting yourself to just day trading, for example, limits your possible profitable trades. Sometimes your financial profile limits your trading, but the VC PMI can serve you as a GPS for day, swing or position trading. The system can be tailored for each trader, including their style, risk tolerance, size and goals.
Gold activated a weekly short trigger at $1771.20. You already had a chance to take a profit from that trade. The market short-term daily is trying to adjust to the weekly signals. The daily numbers are used to identify trading opportunities for day trading, but you want to compare those numbers to the weekly signals. But never convert your day trading objectives or a day trade into a longer-term trade in the middle of a day trade.
The volatility has broken all the benchmarks. A $30 or $40 move in a week or even a day is becoming more common. For those self-directed traders who are looking to capture the short-term volatility of the market, which is a tremendous opportunity, the VC PMI can greatly help you. You always want to be aware of the risk of an instrument and of a trade. Be clear about your financial and risk profiles. Your objectives should be clear going in. Futures are highly leveraged, risky and volatile, but you can profit or lose relatively quickly short term. It is not for everybody. The volatility takes a special person to handle the stress of a futures contract. Understanding the dynamics of risk and that almost everyone is emotional, a key is to eliminate emotion from your trading. The VC PMI allows you to do that: trade without emotion. It also helps to eliminate the chatter of the media and of fundamentals, which can be very distracting.
Gold came down to the $1765 level daily, while the weekly is still on a short trigger with the weekly target of $1740. Daily, gold is in an area of support. The daily target is $1781, but it is being met by sellers around $1774, which is the Sell 1 target. The weekly signal says to expect supply, which is what we are getting. The market is trading between $1765 and $1774, which is a nice trading range to make a few hundred dollars day-trading.
On the monthly and yearly for gold, what we see is that the market made a high yesterday of $1796.10. It came right into almost the weekly level of $1797 and the monthly $1799. The annual target that we have been expecting since September 28, 2019 is $1803. This rally came pretty close to completing the monthly and annual targets. Now gold is activating the weekly Sell 1 level below $1774 and the daily Sell 1 level.
Fundamentals
The fundamentals collapsed in March. The Main Street economy is still dealing with the damage caused by that collapse. Regardless, the stock market appears to have discounted that damage and has rallied almost back to the levels before the crash. The E-mini, for example, got back to 3231 on June 8. The high before the COVID-19 collapse was 3387. We have seen this rally in the face of continuous negative economic and healthcare news globally. Central banks have gone into unlimited quantitative easing, printing as much money as needed. They appear to be ignoring the damage this could do long term. Part of the bullish mentality is the fact that the Fed, because of the unlimited stimulus, has put in a confidence floor.
E-mini 500 S&P
(Click on image to enlarge)
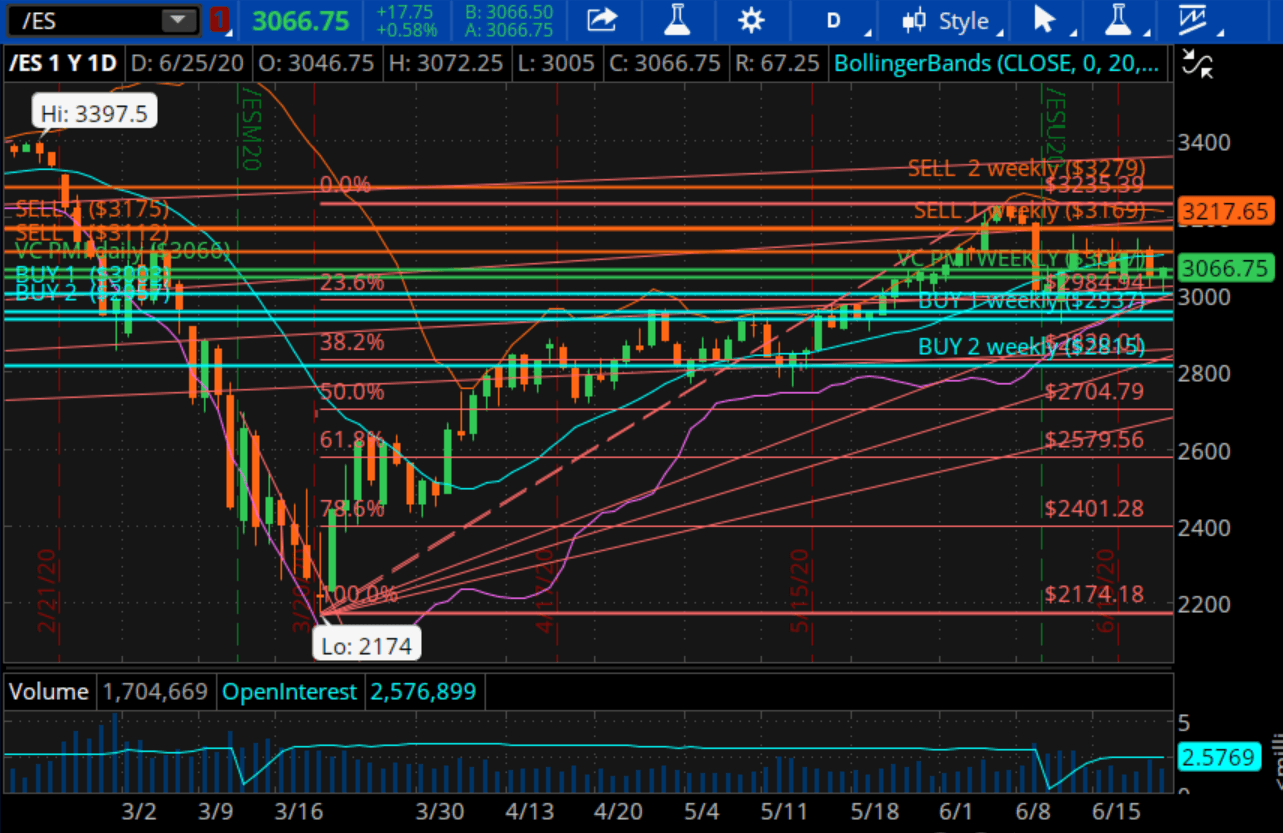
This is the sentiment that is driving the market up since the low at 2174. This rally potentially is the second wave, as most Elliott wave theorists would call it. The second wave usually is a corrective wave. The termination of this wave pattern usually comes in five waves. This was the first wave and the start of the bear market in equities. It established the bottom, with about a 38% decline in the E-mini. We have rallied pretty close to 70% or 72%, and we have made a potential top in the E-mini, using conventional wave counts. When we add the VC PMI to the equation, then we begin to identify the area of distribution of supply. As the market comes up into this level, you can expect sellers or supply to come into the market. The market is overbought. 3112 was the daily Sell 1 level. The daily Sell 2 level is 3175. This weekly signal has been active since Saturday. If you were long, this was where we told you to lock in profits and go neutral. If it closes below, it would activate a short trigger.
The signal coming into today came down to a low of 3005, which was close to 3003. This happened in the middle of the night US time, but when Europe was trading. It has been in a short trigger since 2:30 am Pacific time. The market came down to 3011 from the trigger of 3036. We recommend you trail your position with a stop so you can lock in profits.
Silver
(Click on image to enlarge)
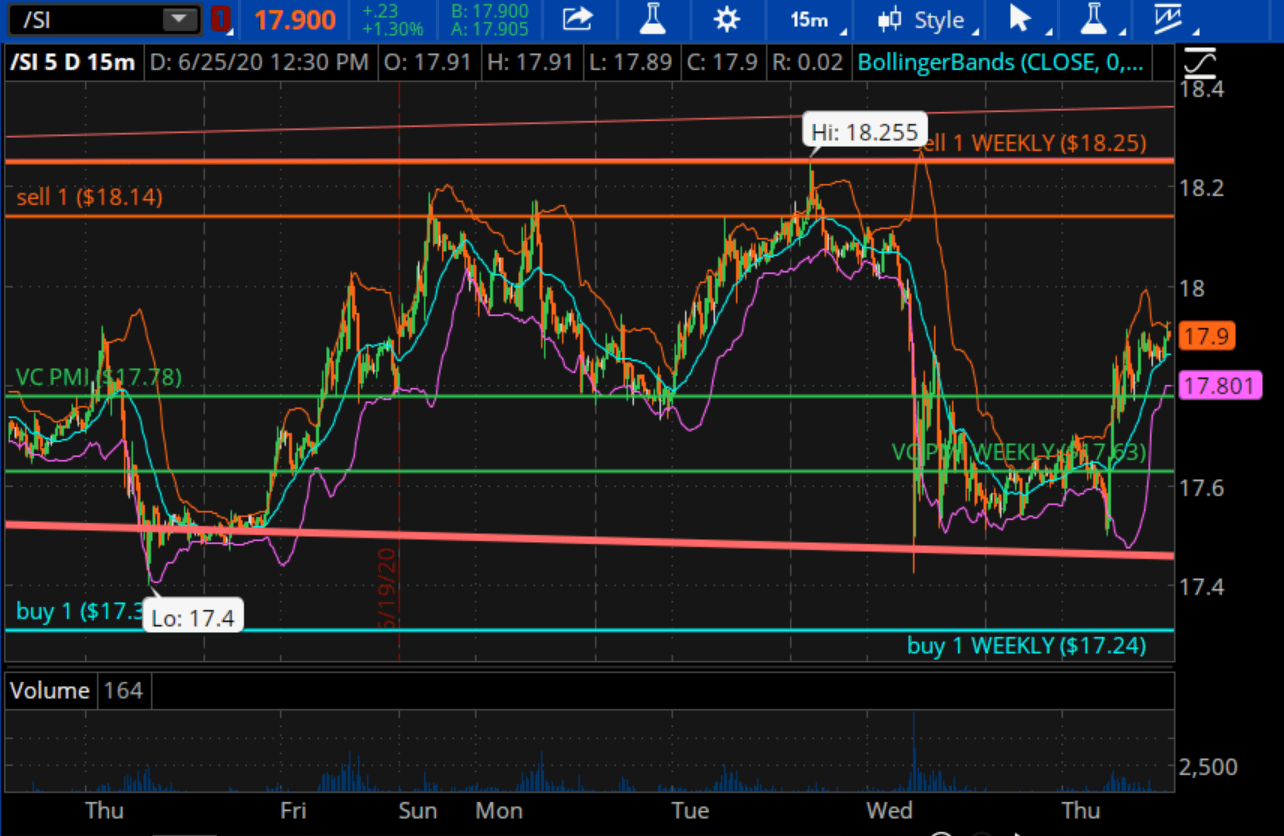
Silver’s average price for today is $17.78, while $17.63 is the average weekly price. Silver is at $1784.50, trading above the daily and weekly, and has activated a bullish price momentum. The target above is $18.14. If you want to eliminate the risk of a futures contract, you can trade other derivatives underneath silver, such as ETFs, individual stocks and other instruments.
We recommend that you keep an eye on the daily, weekly and monthly VC PMI numbers. Even if you don’t trade all three, it allows you to keep track of any harmonics between the three trends.
Currently, there is no buy or sell signal in silver. We are looking for silver to revert back down so we can buy into the market. The blue zone is the area that the VC PMI identifies as a high probability of finding buyers. The red area above is where the VC PMI says there is a high probability of finding sellers. So, now the VC PMI says to wait for silver to go lower or higher. Do not trade when the price is around the daily, weekly or monthly average, since it is a 50/50 standard deviation and the price can go either way. Wait to trade when the price is at an extreme level above or below the mean.
More buyers who are staying long in the market are at record numbers, particularly in the silver market. We are waiting for a reversion in the price of precious metals to go back down to the extreme below the mean. Ideally, the best place to buy it would be at $1719-1685. In silver, the ideal place to buy is between $17.31, $17.24 and $16.95. For the E-mini, it has entered a weekly bearish price momentum and has activated the Buy 1 weekly level of 2937, with near-term targets in between all the way down to 2815.
Disclosure: I am/we are long GDX. I wrote this article myself, and it expresses my own opinions.
To learn more about how the VC PMI works and receive weekly reports on the E-mini, gold and ...
more

