
A Tale Of Two Sentiments
There are a number of methods that are commonly used to measure fear in the market. Here we look at the AAII survey and the total put-to-call ratio.
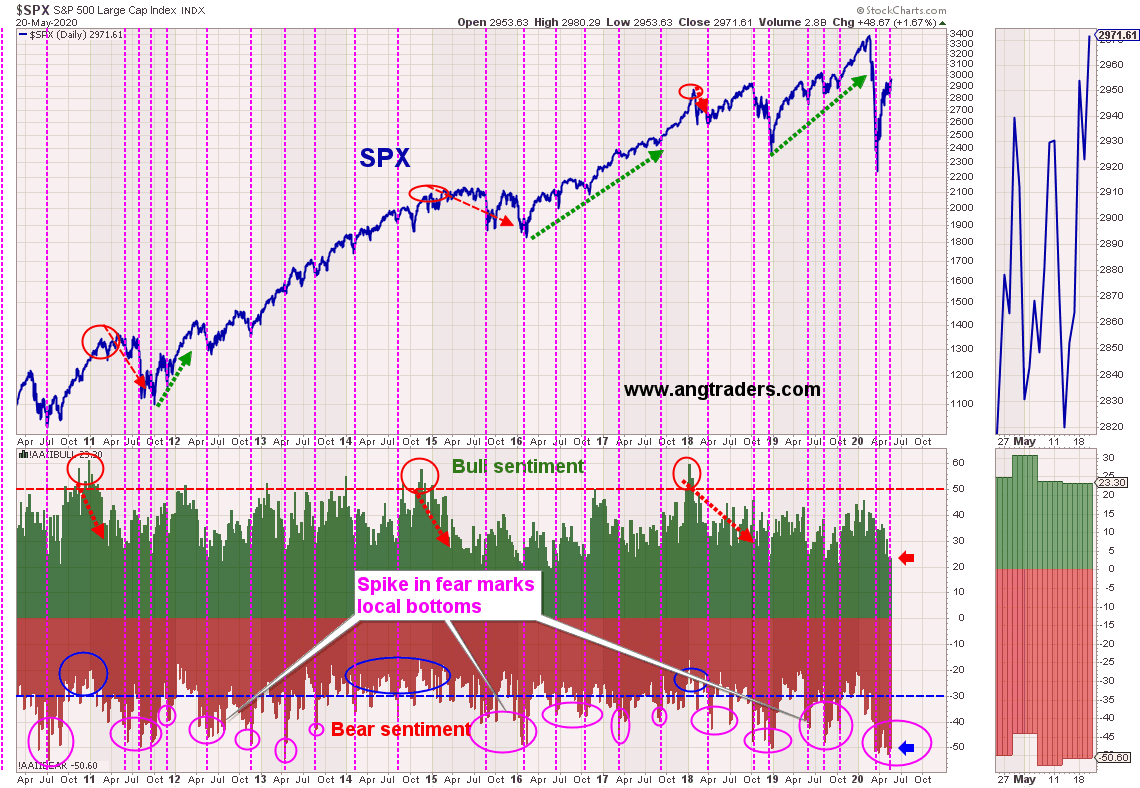
The American Association of Individual Investors (AAII) weekly survey asks respondents whether they think the market will be higher, lower, or unchanged in six months time. Historically, spikes above 50% bullish sentiment, and bearish sentiment below 30% have correlated with highs in the S&P 500. While bear sentiment greater than 30%, and bull sentiment less than 25% correlates with market lows. The latest survey shows 23% bullish, and 50% bearish sentiment. This implies a level of fear that is common at market bottoms (chart below).
(Click on image to enlarge)
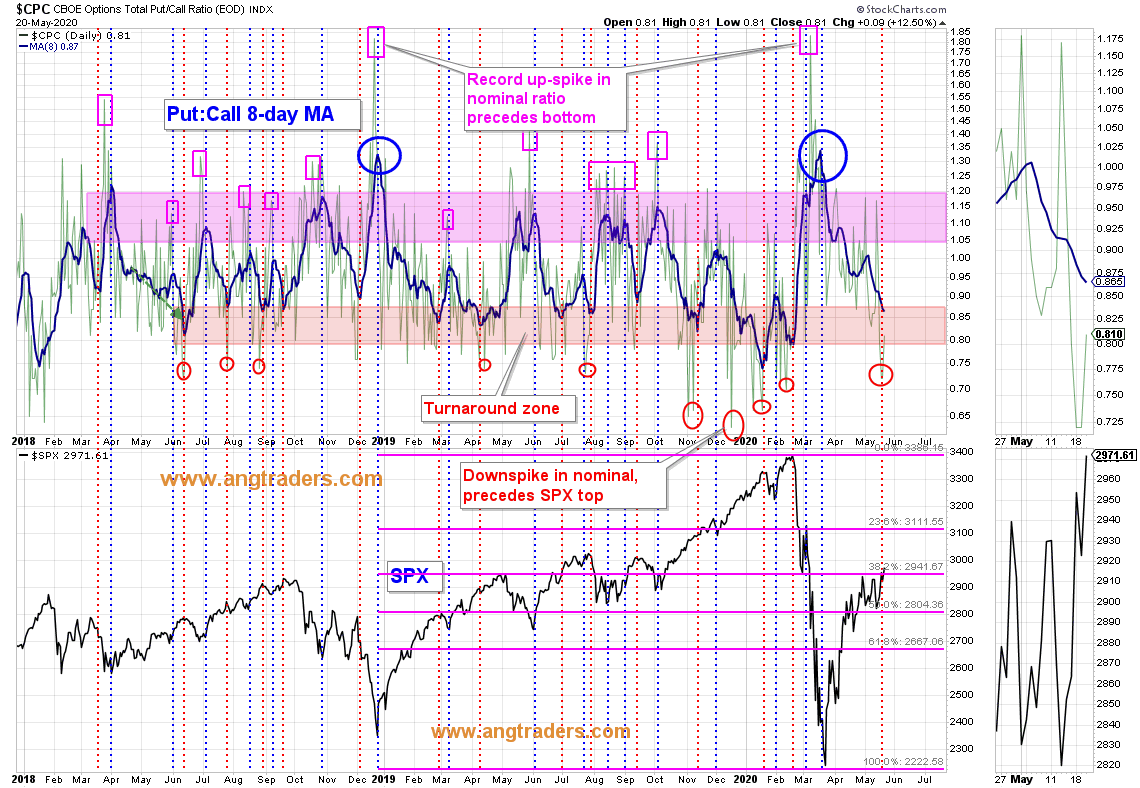
The total put:call option ratio measures the level of hedging; high ratio values mean elevated put volume and increased fear, while low ratios mean elevated call volume and a high level of bullish confidence (fear of missing out). The chart below shows the that the 8-day moving average of the total put:call ratio has descended into an "overly-bullish" zone which often precedes market highs.
(Click on image to enlarge)
Conflicting sentiment signals may indicate a local top within a long-term bottom.


