A Rare Selloff On Wall Street
BOUNCE ATTEMPT POSSIBLE IN COMING DAYS
According to breadth data from stockcharts.com, yesterday was the worst NYSE Advance-Decline Volume session in history. Given total market volume has changed significantly over the past 80 years, it is more relevant to compare today’s selloff to the recent past. As shown in the chart below, NYSE Advance-Decline Volume posted the lowest reading in the last decade (by a wide margin).

The last reading in the ballpark of yesterday's came on December 24, 2018. We all know Christmas Eve 2018 marked an important low. Is it possible for an oversold market to keep dropping? Yes, however, from an odds perspective, it would not be shocking to see at least a significant bounce in the coming days. The table below shows what happened in the stock market after extremely low NYSE Advance-Decline Volume readings in 2010, 2011, 2016, and 2018. In all four of the recent cases, the S&P 500 was higher seven calendar days later by an average of 5.01%.

From a longer-term and keep-an-open-mind perspective, we have to respect selloff (a) may not be an important low (see 2010), and (b) could possibly be a form of a bearish breadth thrust. The table above simply helps us understand good things can happen after sharp “run for the exit” selloffs.
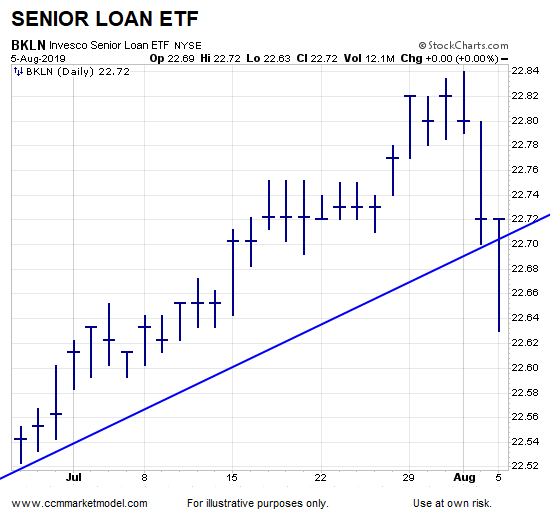
The Senior Loan ETF, which was helpful in January 2019, was able to rally into Monday’s close and finish flat for the day. The 10-2 yield curve also improved Monday (moved further away from inversion).
As pointed out on the @OddStats Twitter Feed, it is extremely rare for a Monday to be down more than 2% when the previous week ended with three red sessions of 0.70% or more. It has occurred eight other times since 1950. The table below shows stock market performance was positive after 14 calendar days in all of the historical cases since 1950.

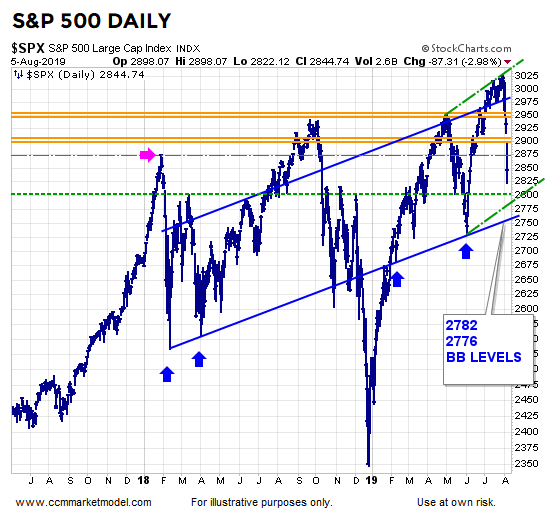
Our allocations, which include the cash raised last week, bonds, and gold, remained in line with the data at Monday’s close. Additional adjustments may be called for, especially if the S&P 500 fails to make a stand somewhere between Monday’s close and 2750-ish. The blue and green lines below come in between 2770 and 2800-ish. The S&P 500’s weekly chart has a lower Bollinger Band at 2776; the monthly Bollinger Band centerline currently sits at 2782. All of these guideposts are within 3.3% of Monday’s S&P 500 close.
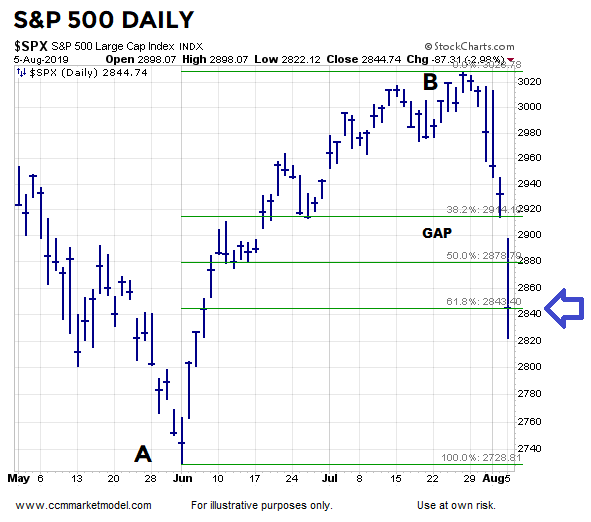
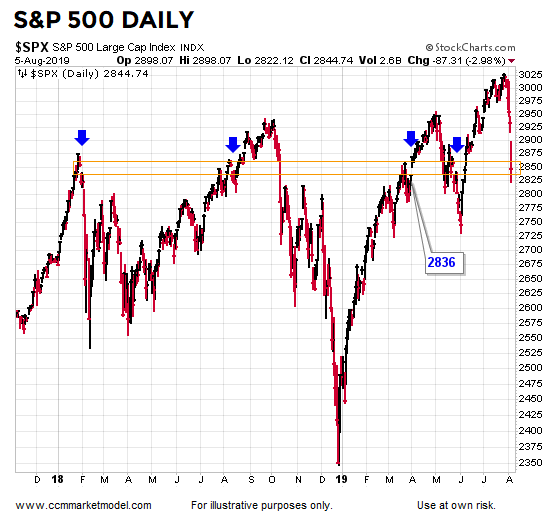
Monday’s close came near the 61.8% retracement of the rally that began in early June.
Monday’s close also came near an area that featured four gaps (blue arrows below). While these gaps have been filled, it still tells us the market has deemed this general area to be important in the past.
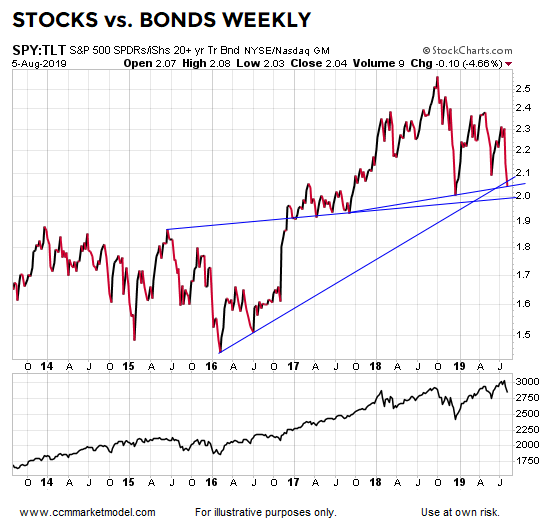
Another possible guidepost comes on the weekly chart of stocks (SPY) versus bonds (TLT). The ratio has made a stand near Monday’s close on several occasions. At the end of the week, we will learn something either way (bullish or bearish).
UNTIL THE MARKET CAN MAKE A STAND, CONCERNS REMAIN
This week’s video outlines numerous short-term developments that prompted some profit-taking and defensive positioning last week. Monday’s session did not alleviate these concerns.
LOW, BOUNCE, OR BEARISH BREADTH THRUST
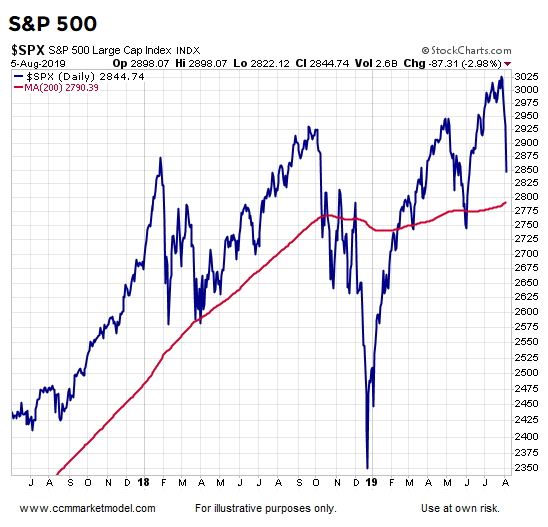
Given our current allocations, model readings, rare oversold nature at the end of Monday’s session, and the fact that potential support is within 3.3% of the close, it was prudent to see if the market can try to make a stand or bounce in the coming days. The concerns outlined in this week’s video remain, and we have to expect that rare and lopsided breadth sessions are most often found near lows, but they can also surface in the early stages of declines that still have room to run. Therefore, it is extremely important that we keep all options on the table, including selling into strength on what could be a short-lived bounce attempt. As shown in the chart below, the S&P remains above an upward-sloping 200-day moving average. The market recently made a higher high and has yet to print a lower low. For now, we must balance the very concerning short-term data/facts with the still constructive longer-term facts.
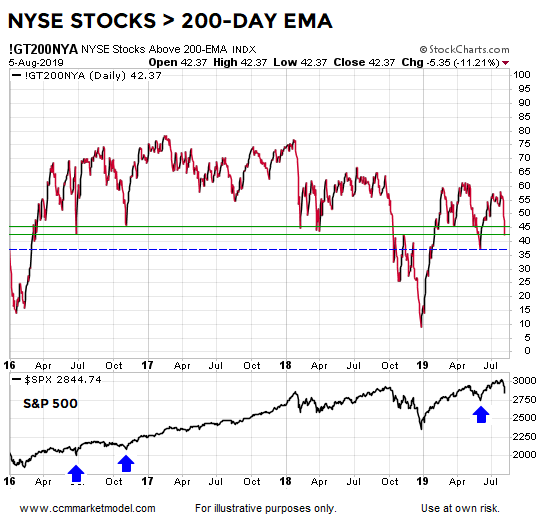
The chart below also aligns with the possibility of the market trying to make a stand in the coming days. The percentage of NYSE stocks above their 200-day exponential moving average is sitting near an area where the S&P 500 made a bullish stand twice in 2016 (see first two blue arrows and green lines). The blue dotted line shows the reading at the S&P 500’s June 2019 low. Like all the charts above, we will learn something either way.