
A Quick Explanation Of Silver And Gold's Recent Volatility And Likely Direction
Both gold (GLD) and silver (SLV) had major rallies and pullbacks this week. A simple guide for novice short term and day traders of precious metals for the days ahead
- Why the sudden rally in gold and silver Monday and Tuesday
- Why the equally strong pullback that followed
- Short term trade guidance for both precious metals
Why The Sudden Rally?
As we noted at the end of Thursday’s article the surprise rally Monday and Tuesday in both gold and silver was ignited by news of a large, long anticipated Venezuela gold sale. The removal of this threat to gold prices brought gold buyers. As usual, silver followed gold’s move. Both gold and silver were at near term support levels, so the initial stages of the rally had some technically driven bargain hunters buying at those support levels.
Why The Sudden Pullback?
We correctly predicted in our Tuesday post that in the coming day) they’d remain in a relatively narrow flat trading range in the coming 24 hours. However by Thursday both gold and silver’s prices fell hard, with both giving back most of their gains and returning to their recent trading ranges. Why?
FOMC Statement More Optimistic Than Many Expected
As we predicted in our April 28 post the Fed believes the weakness in Q1 data (like Wednesday’s disappointing advanced Q2 GDP result) is temporary. Thus a USD-supportive rate hike is still likely, albeit unlikely to happen in June. Gold and silver are priced in US dollars, so they tend to fall on bullish USD news.
Thursday’s Data Supports Fed’s Positive Outlook, USD 2015 Rate Hike Hopes
Weekly new unemployment benefits claims applications fell to a 15 year low, and the Chicago PMI beat expectations too, albeit modestly. There were some weaker reports too on Thursday (like personal spending and core PCE price index), but the USD’s minor bounce early today suggests that traders were focusing on the positives.
Technical Selling
By the end of the rally’s second day, Tuesday, both gold and silver had failed to break above the next key long term resistance levels on their daily charts. For example, gold failed to even reach the $1215-20 level (comprised of both a clear price resistance at this level as well as the 38.2 Fibonacci retracement level drawn from Gold’s January high around $1300, as shown in the chart below.

Gold weekly chart. Key: 10 WEEK EMA DARK BLUE, 20 WEEK EMA YELLOW, 50 WEEK EMA RED, 100 WEEK EMA LIGHT BLUE, 200 WEEK EMA VIOLET, DOUBLE BOLLINGER BANDS NORMAL 2 STANDARD DEVIATIONS GREEN, 1 STANDARD DEVIATION ORANGE. HIGHLIGHTED AREA IS LONGER TERM RESISTANCE LEVEL FORMED BY RECENT PRICE HIGHS AND THE 38.2% AND 50% FIBONACCI LEVELS.
Source: MetaQuotes Software Corp, www.FXGlobe.com
02 May. 01 08.02.jpg
Once the rally had halted at this key resistance zone, those who had bought gold earlier had probably moved up their stop loss orders to just below the low of Wednesday’s candle around $1200. Thus when gold broke below this level on Thursday, it likely triggered a mass of these sell orders and exacerbated the sell-off. Thus gold fell to the next logical support area around $1175 – 85.
Again, the same thing happened to silver as it stayed true to type and roughly followed gold, though it held about half of its gains from the rally.
Trade Idea For Gold, Silver: Trade The Up-trending Channel
As we near the close of Friday’s Asian session and the opening of Europe’s, we can see from the chart below that since midday Thursday both gold and silver are making a minor recover bounce within the up trending channels shown below.
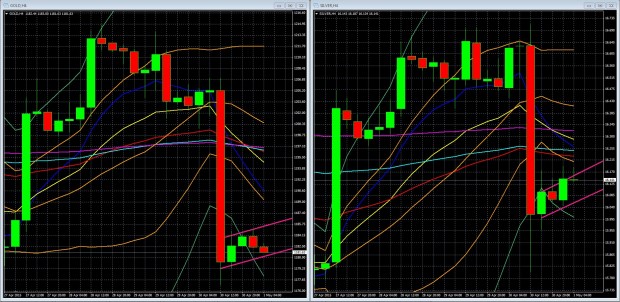
GOLD, SILVER 4 HOUR CHARTS Key: Indicators irrelevant for these near term range trading of these channels.
Source: MetaQuotes Software Corp, www.FXGlobe.com
03 May. 01 08.35.jpg
The upper and lower lines of the channels represent reasonable resistance and support lines for short and long short term entries.
Risk Management Reminder
As always, be careful about attempting to trade against the trend when range-trading channels.For the above rising channels, that means avoid trying to short gold or silver unless you can enter at the very top of the channel, and also have a tight stop loss.
As always, have stop losses in place to protect against the large losses from sudden surprise price swings, like the ones we’ve had this week in both gold and silver.
Key News To Watch
As of this writing the Asian session is winding down and Europe is set to open. Today’s calendar is relatively light. However, an exceptionally bullish US ISM manufacturing PMI report could lift the USD and thus pressure gold and silver. If the PMI report misses expectations, expect the opposite effect.
Disclosure: The above represents the personal opinion of our Chief Analyst, and is not represented as any guarantee of what will happen by him or ...
more

