
A Monday Dirty Dozen
Opinion is like a pendulum and obeys the same laws ~ Arthur Schopenhauer
Good morning!
In this week’s Dirty Dozen [CHART PACK] we look at technical and sentiment indicators showing short-term overbought levels in US equities, incredibly low hedge fund exposure to stocks, the ‘pain points’ for CTAs in bonds, really cheap European banks and more. Here we go…
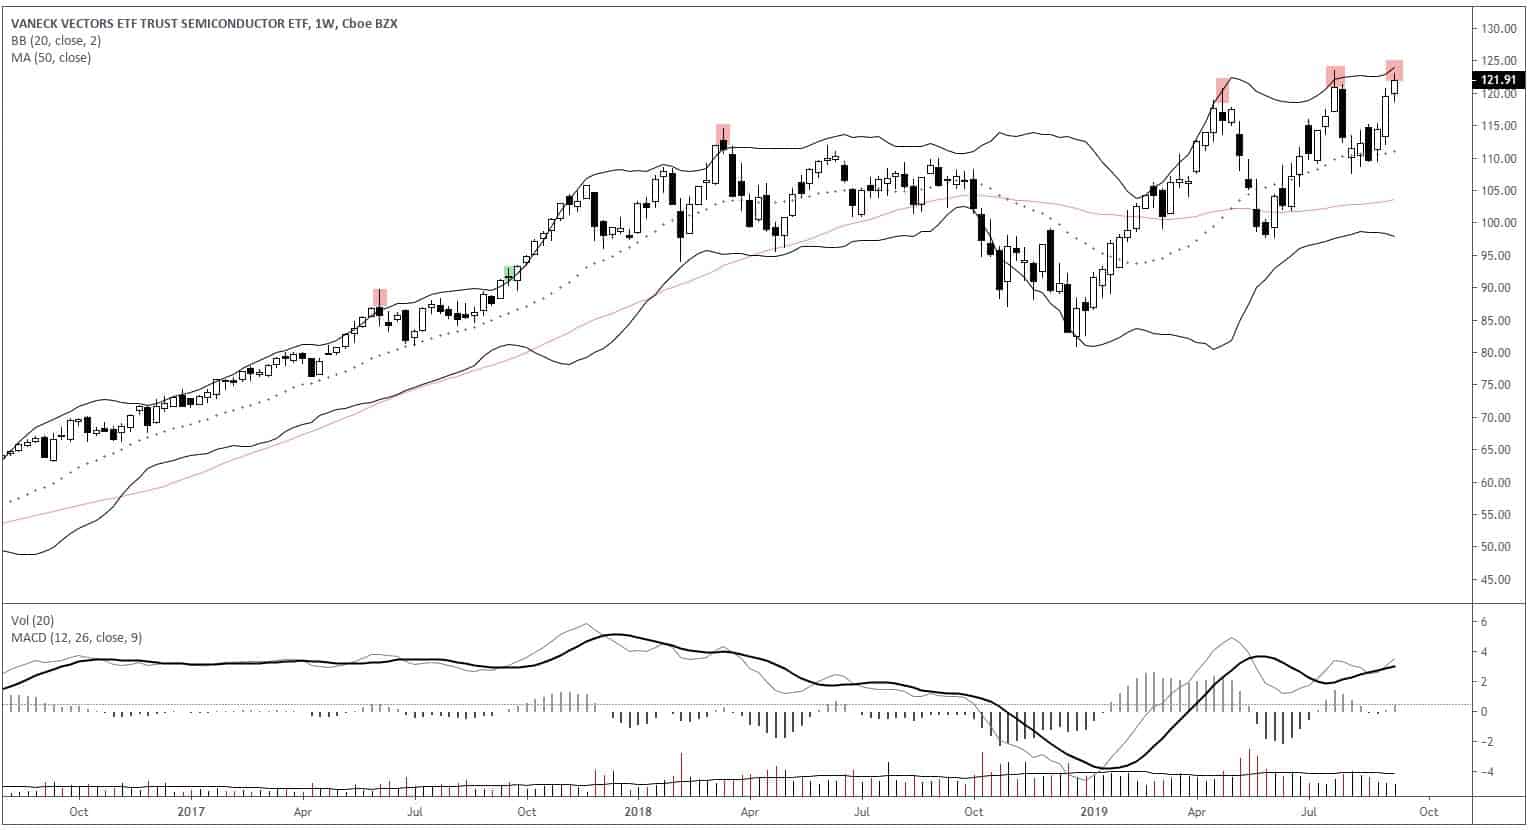
1. We saw the bullish thrust in stocks that we were expecting but now things are overstretched and odds are we see a slight pullback in the coming week(s) before the next leg higher, though we can’t rule out the possibility of a short FOMO pop higher either. Dow Transports (IYT), Russell Small-caps (IWM), S&P 500 (SPY), and Semis (SMH) are all knocking on significant resistance on a weekly timeframe.
![]()


2. Supporting the above, my short-term indicators for overbought/oversold technicals and sentiment show that the market is going to need a breather soon. The 3-day MA of Calls/Puts (thin red line) is beginning to signal complacency and 14-day RSI is becoming stretched.

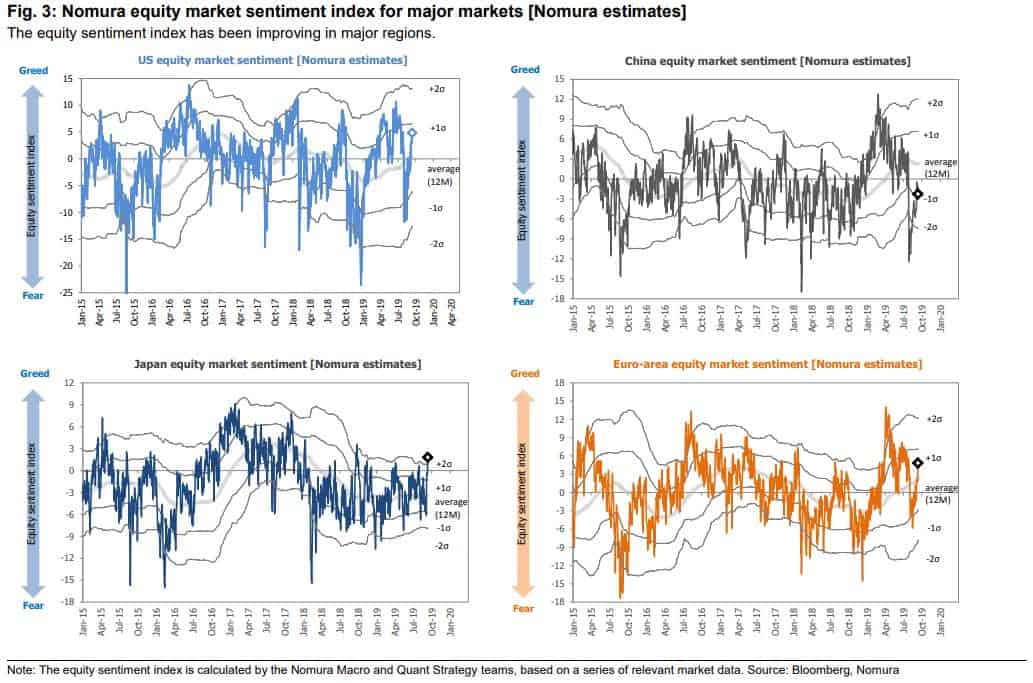
3. Nomura’s Equity Market Sentiment Index is also showing that sentiment has quickly flipped from uber-bearish to bullish in the US — too quickly for my liking and tells me that we’re likely to see a bumpy trend higher or another severe washout to cement enough pessimism for a smooth run-up. Also, check out Japan. Its bullish sentiment is over the 2 sigma level. I wrote the other week (link here) about why I’m bullish Japanese stocks but, like the US, it’s technically overbought and sentiment is a little too hot. Gotta wait for a pullback.
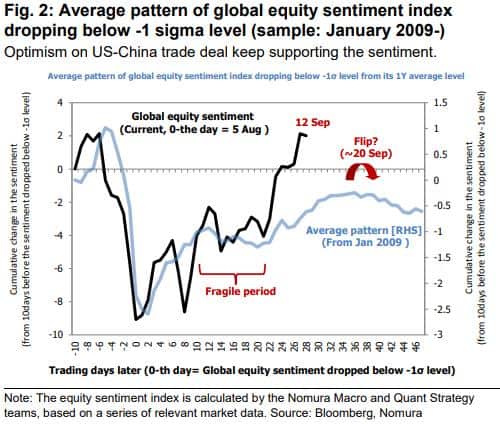
4. Here’s the average pattern of Nomura’s global equity sentiment index following a drop below the -1 sigma level. If we follow the historical pattern then we should see sentiment flip over on September 20th.
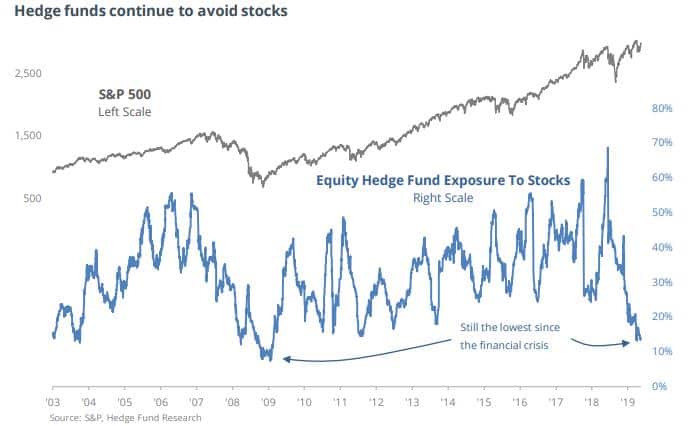
5. I’m bullish looking out past 1-2 weeks and one of the BIG reasons is positioning, which I’ve been noting nearly weekly here in these pages over the last month. Here’s a great chart from Sentiment Trader showing that hedge funds are grossly under positioned considering the macro backdrop. That’s a LOT of fuel for the next leg higher.
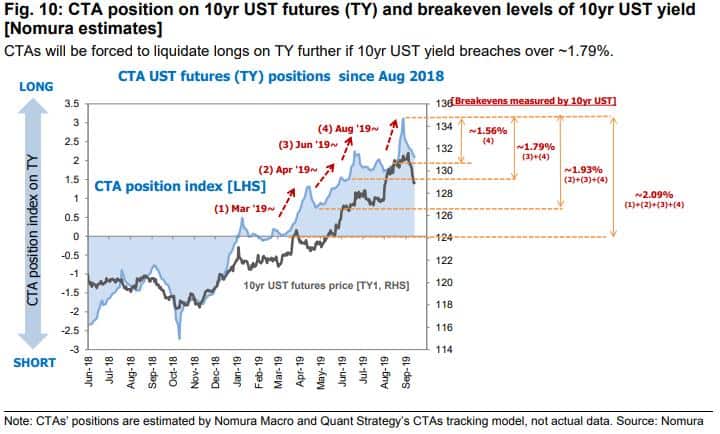
6. The run-up in stocks has put the squeeze on crowded bondholders who’ve suffered one of their biggest routs in years. Nomura’s nifty CTA positioning tracker breaks down the likely ‘pain points’ of systematic trend followers in the UST 10-year. The next measured liquidation area is at 1.93% (yields ended the week at 1.90%).
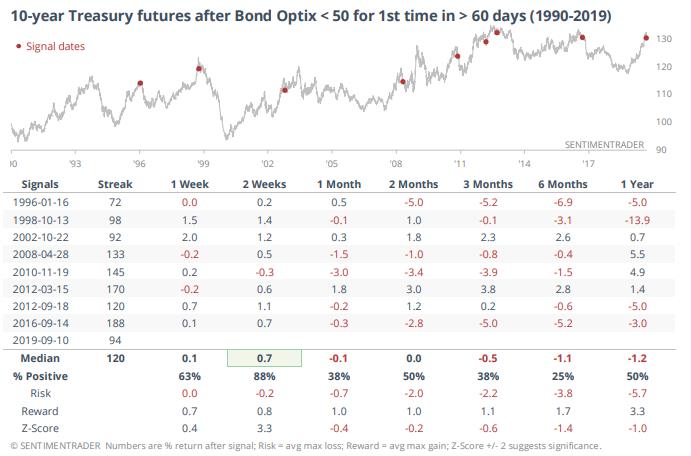
7. Sentiment Trader’s Bond Optimism Index fell below 50 for the first time in over four months on Friday. The backtest shows that bonds on average experienced a snapback rally over the following 2-weeks before resuming their downtrend (note: this would fit well with our expected short-term retrace in stocks and offer an excellent entry to get short bonds if you’re not already).
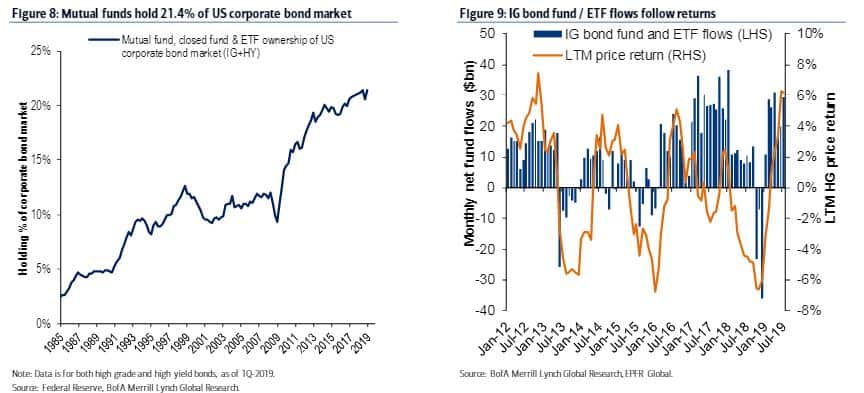
8. I thought this chart was interesting. BofAML recently pointed out that the main risk to US IG isn’t supply but rather demand. And that’s because the ownership share of bond funds and ETFs has risen sharply to 21.4% from just 12% a decade ago. The bank points out that the issue is that “this segment tends to be returns-sensitive, as retail investors chase performance.” The chart on the right is case in point. There’s the possibility that a bond tremor sets off a further bond tremor as traders clamor for the exits.
Also, I highly recommend taking two minutes and watching this short video (link here) I clipped together comparing intros from Bloomberg’s weekly Real Yield show. The first half is from the Aug 30th and the second part is from this weekend. I love this… I mean, just two weeks and look at the change in sentiment. The narrative pendulum swings so incredibly fast in this environment, if you don’t pay close attention you’re likely to get steamrolled.
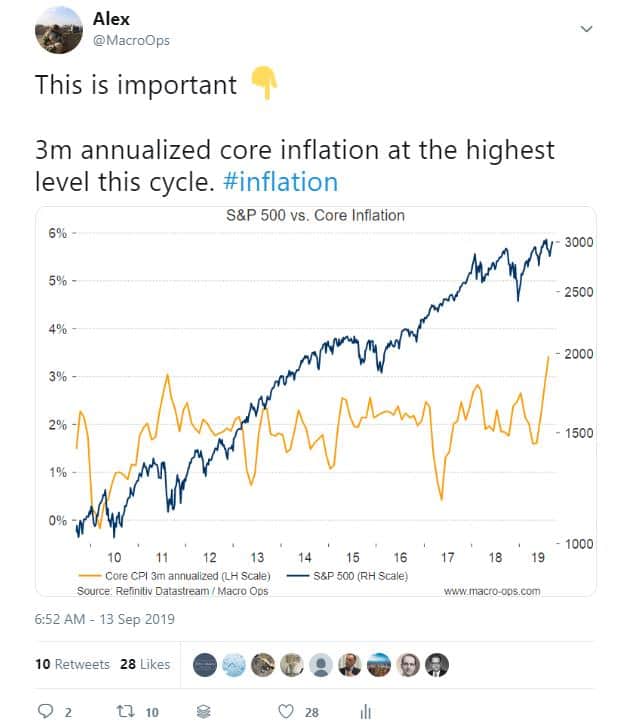
9. Another troubling trend for bonds over the near-term is the recent jump in inflation. The 3-month annualized growth rate in core CPI just hit its highest level this cycle.
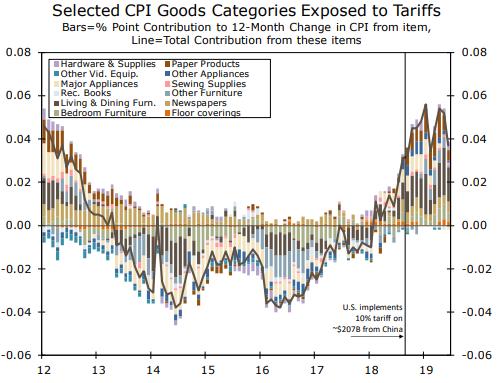
10. If you’re wondering where this jump in inflation is coming from, well, look no further than the trade war. This spike is being entirely driven by the rise in core goods CPI which is a direct result of tariffs (chart via Wells Fargo).
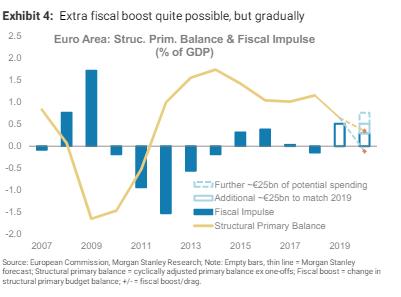
11. Just think what could happen to bonds once the policy baton gets fully passed from monetary to fiscal. Negative yields in Europe have been helping to drag down those in the US. If fiscal spending picks up in Europe and yields there begin to rise, then there goes the anchor…
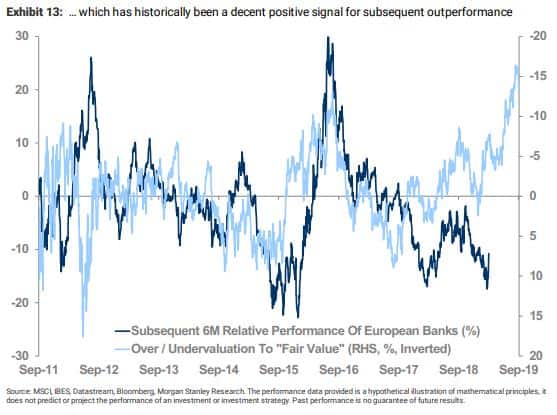
12. Speaking of Europe, banks there are trading near all-time lows relative to ‘fair value’. According to Morgan Stanley, similar instances in the past have led to periods of extended outperformance. Deutsche Bank (DB) is up more than 30% over the last month…

Disclaimer: All statements are solely opinions and are for educational purposes only.


