
A Microscopic Look At The Elliott Wave & The S&P 500
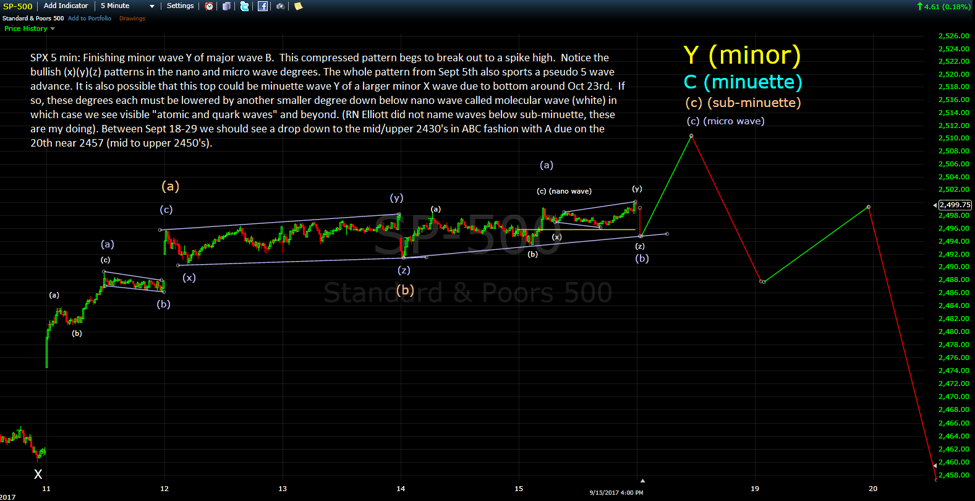
Most so-called Elliotticians often times make incorrect wave counts because they don’t look at the microscopic waves that one sees at the 5 minute and even 1-minute bars.While there can be alternative counts that work within the true wave structures as put forth by R.N. Elliott, most wavers are seeing far too many 5 wave counts in the current wave structure.Since 2009, we’ve been in Cycle Wave 5, a 5-wave count going back to 1942. Primary Wave 3 of Cycle Wave 5 ended late in 2014 and we have been in Primary Wave 4 ever since.
While there can be some 5 wave counts, especially in the last C Waves up, we are not in a true 5 wave count anymore and won’t be until Primary Wave 4 terminates. I don’t expect this will occur until early 2019.This would place the final Primary Wave 5 terminus of Cycle Wave 5 sometime into early/mid-2020 (2020-22/23 should see a nasty bear market, the worst since 1929-32).
The charts below are 5-minute bars and 60-minute bars.
(Click on image to enlarge)
(Click on image to enlarge)
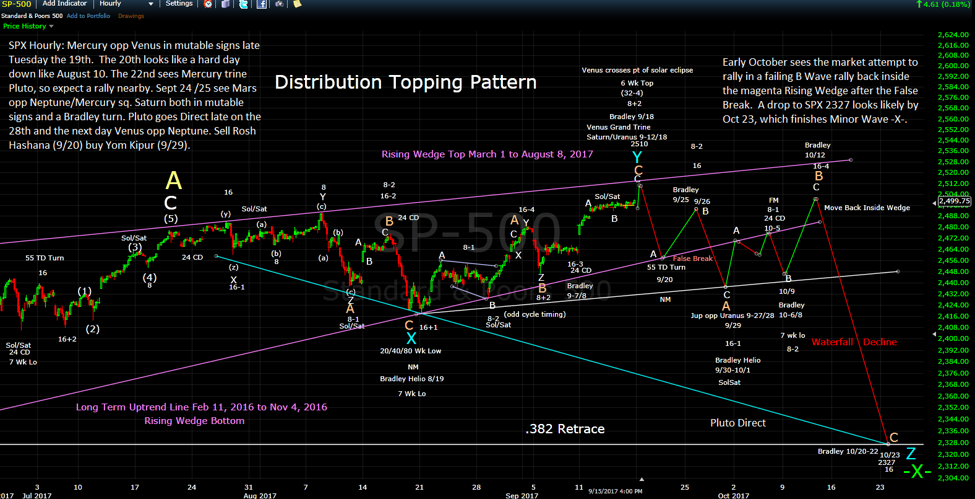
The 60-minute chart shows a topping distribution pattern from late July into early October and a bearish rising wedge. The blue XYZ pattern begs for higher prices into early December.The cycles beg for another lower low late in the year around December 29 (SPX 2230). Right now, it seems to me that December 2017 will not be kind to the stock market and to a lesser extent, neither will mid-October (Oct 12-23). December 2017 looks to have the same cycle as the October 2014 drop that was blamed on the Ebola scare. This cycle runs about 3 years, 2.5 months. Based on this cycle, Wave 4 won’t top out (Wave Y) until early August 2018 (Wave X being February 11, 2016).
My wave count has July 20 being the A Wave top of Y with B due by year end then C of Y (or an irregular top of Primary Wave 4) due by early August 2018 (near 2590/2600). By early 2019, I see the 2073 area tested (about 20% down from the peak) creating a powerful running correction (testing the top of Primary Wave 3).
All indications suggest a final high in early 2020 of nearly 3750 SPX based on the Equality of Waves Principle of Waves 1 and 5 (time and price). If the final 5th wave is taken back to the Cycle Wave 4 bottom (666) that would portend an 82% drop just ahead (the 1929/32 drop was about 89%).
Regarding the Nasdaq 100, I see new highs into early/mid-October after the late Sept lows are put in. This new high will likely not be confirmed by the majority of indices.
Regarding GDX, there is a 10 week low due soon.While the daily indicators are negative, we may see an attempt to rally soon that will take GDX above the recent highs.
BluStar Market Timer is offering “one free week trial” to all new subscribers.
Contact us at: http://www.blustarmarkettimer.info/
Disclaimer: The information provided by the ...
more

